A decision system for operating under noise, incomplete information, and capital risk. Runs 24/7. Zero margin for error.
Autonomous statistical arbitrage across correlated crypto pairs on Hyperliquid (DeFi perpetuals DEX). Real capital, 7x leverage, 24/7 on-chain execution. I led product and design end-to-end: signal detection, validation cascade, risk escalation, execution logic, and two operator surfaces. Collaborated with quant specialists and leveraged Claude AI for accelerated development.
Mean-reversion on correlated crypto pairs.
Spread deviates beyond a statistical threshold, system trades the convergence. 24/7 crypto markets on Hyperliquid, a decentralised perpetuals exchange. 7x leverage, 7 simultaneous pairs (ETH/BTC, SOL/ETH, LINK/ETH, and other correlated tokens), non-stationary on-chain data. Every decision has immediate financial consequences for the client.
Scope: Decision architecture, interfaces, risk system
Platform: Hyperliquid (DeFi perps DEX, on-chain order book)
Stack: Python, Flask, Telegram Bot API, Web3 / REST APIs
Work: System design, dashboard, Telegram bot, risk framework
Collaboration: Quant specialists (signal model), Claude AI (development acceleration)
Live capital deployment. 7x leverage, 5 pairs max, 3 open positions max. ~60-second tick cycle. 24/7.
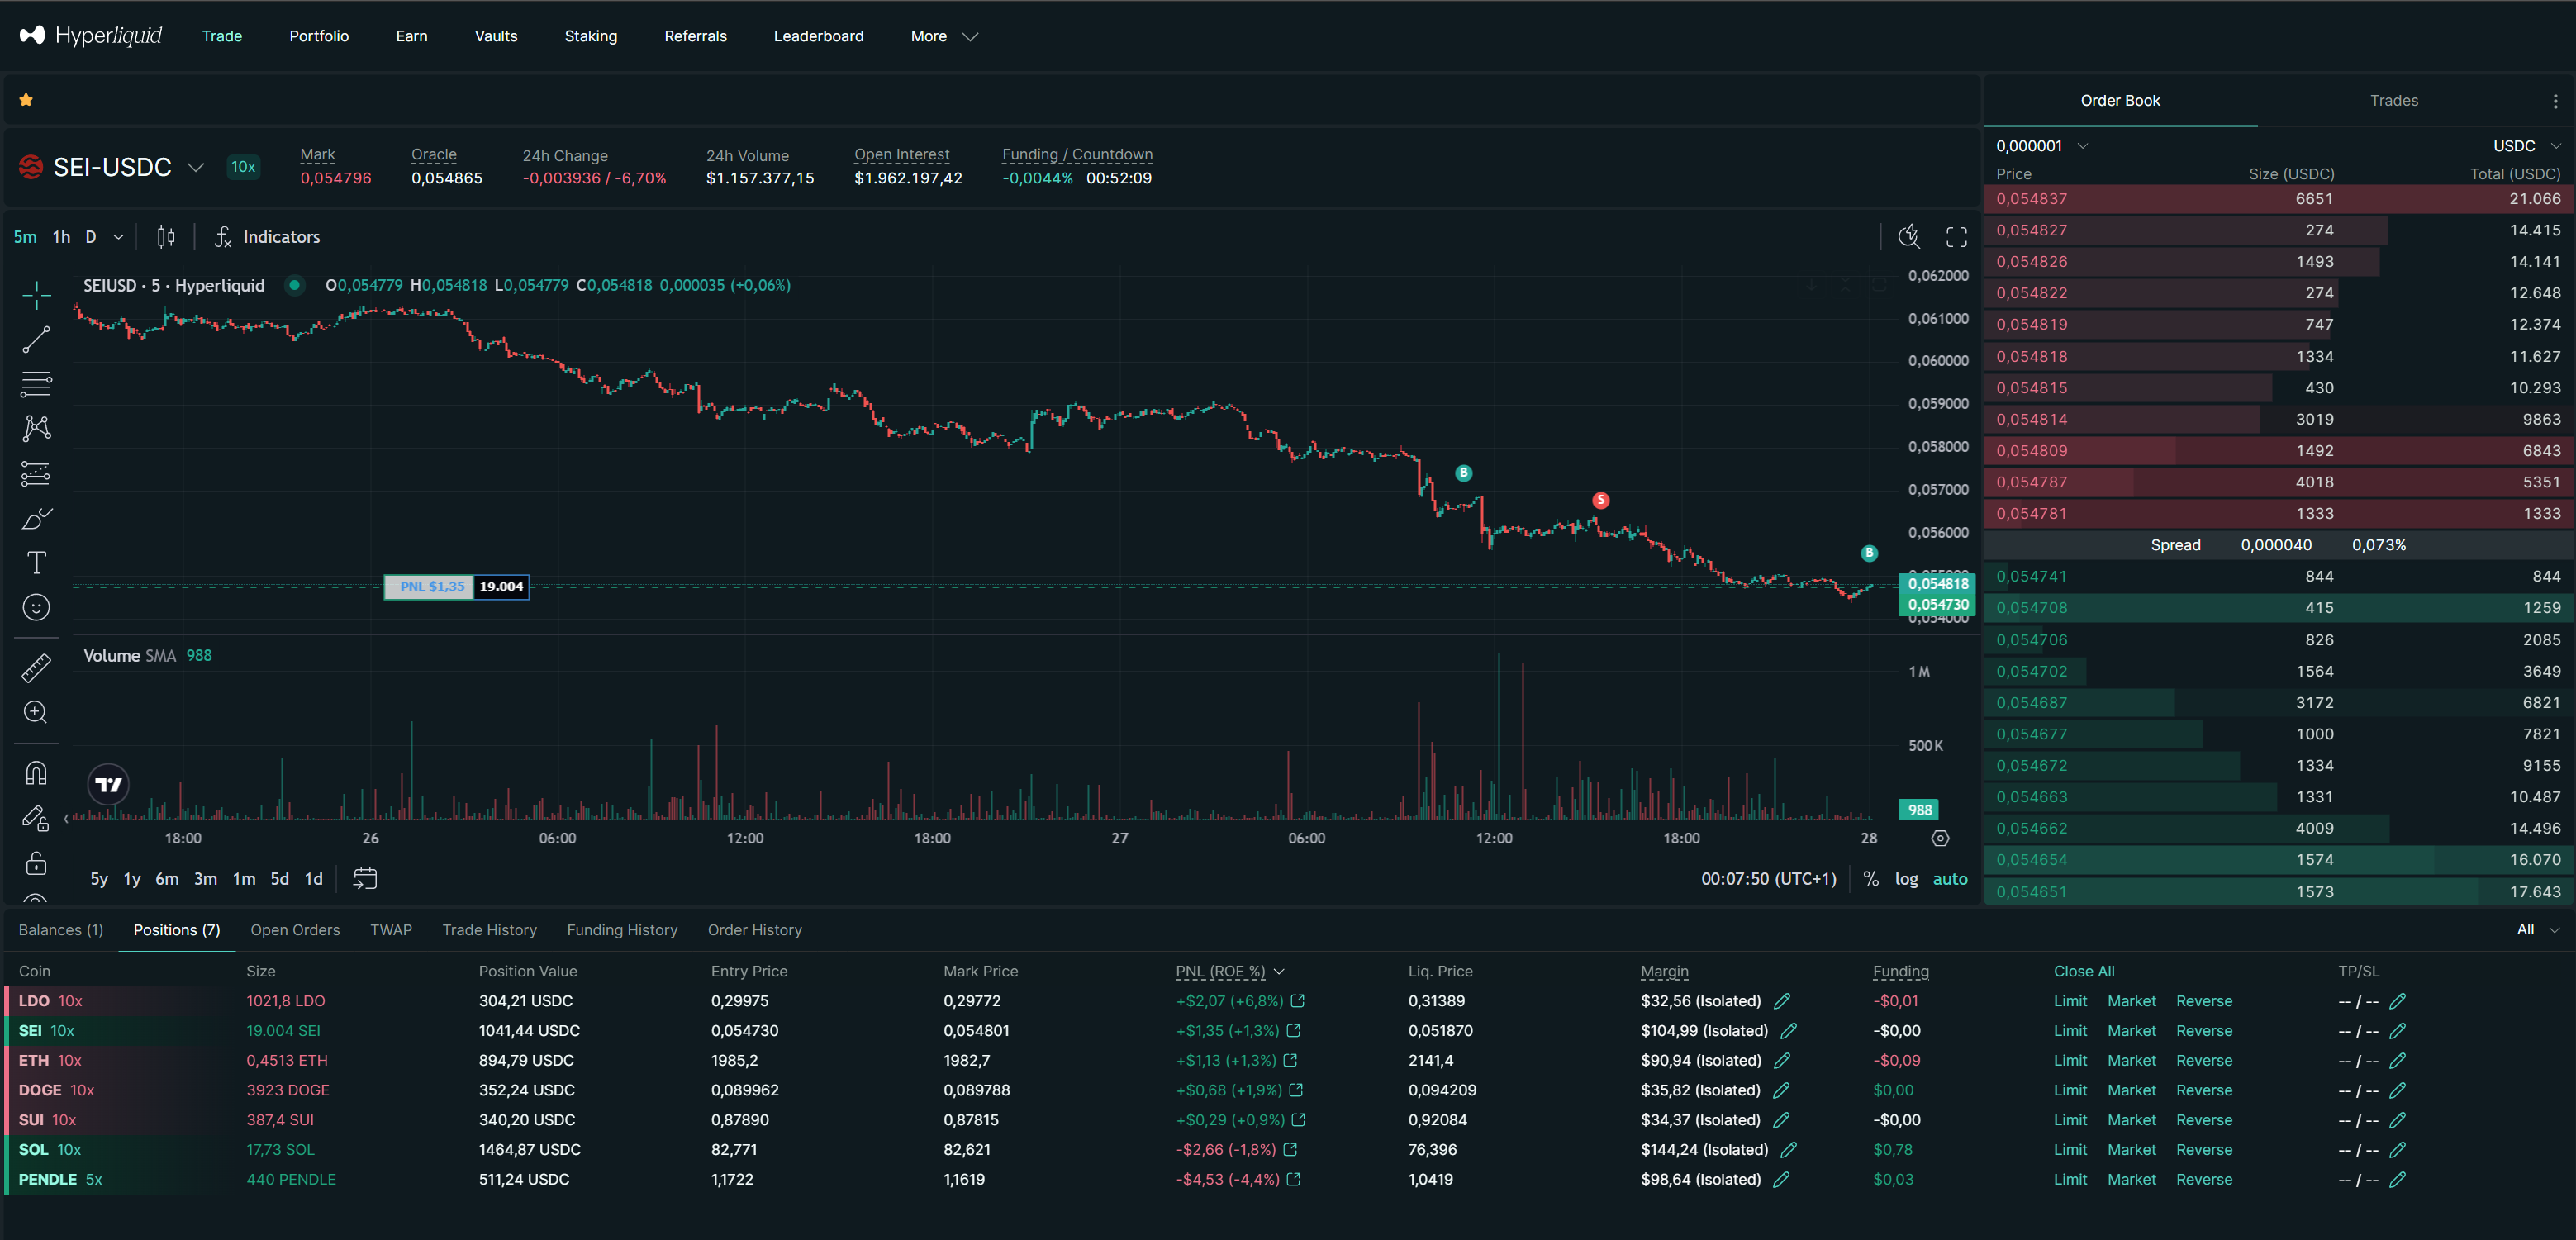
Hyperliquid: the decentralised perpetuals exchange where KODO executes.
v1 was a terminal log with 23 metrics per pair.
Complete information, zero decision clarity. At 2am with leveraged capital moving against the operator, the question isn't analytical. It's binary: "Am I okay right now?" The problem was never information. It was architecture.
- Signals are ambiguous by nature. Non-stationary on-chain data, regime shifts, correlation breakdowns across token pairs. In crypto, hesitation has a cost. Overreaction has a cost.
- Latency is structural. 60-second tick, rate-limited exchange APIs, two-leg execution on a decentralised order book. A signal valid 30 seconds ago may not be valid now. Blockchain finality adds another layer.
- Emotional bias compounds faster than losses. After a drawdown: impulse to recover. After a streak: impulse to increase size. Both destroy accounts.
Most systems fail not because of bad signals. They fail because of bad decision architecture.
The entire 23-metric pipeline needed to collapse into one question: what's the z-score? Entry at 2.4σ, exit at 0.8σ, stop at 4.5σ. At 2am, one glance. Not a lecture.
6-step signal pipeline. One number drives every decision: the z-score.
Four domains: Core, Data, Decision+Risk, Feedback+Interface. 12 modules.
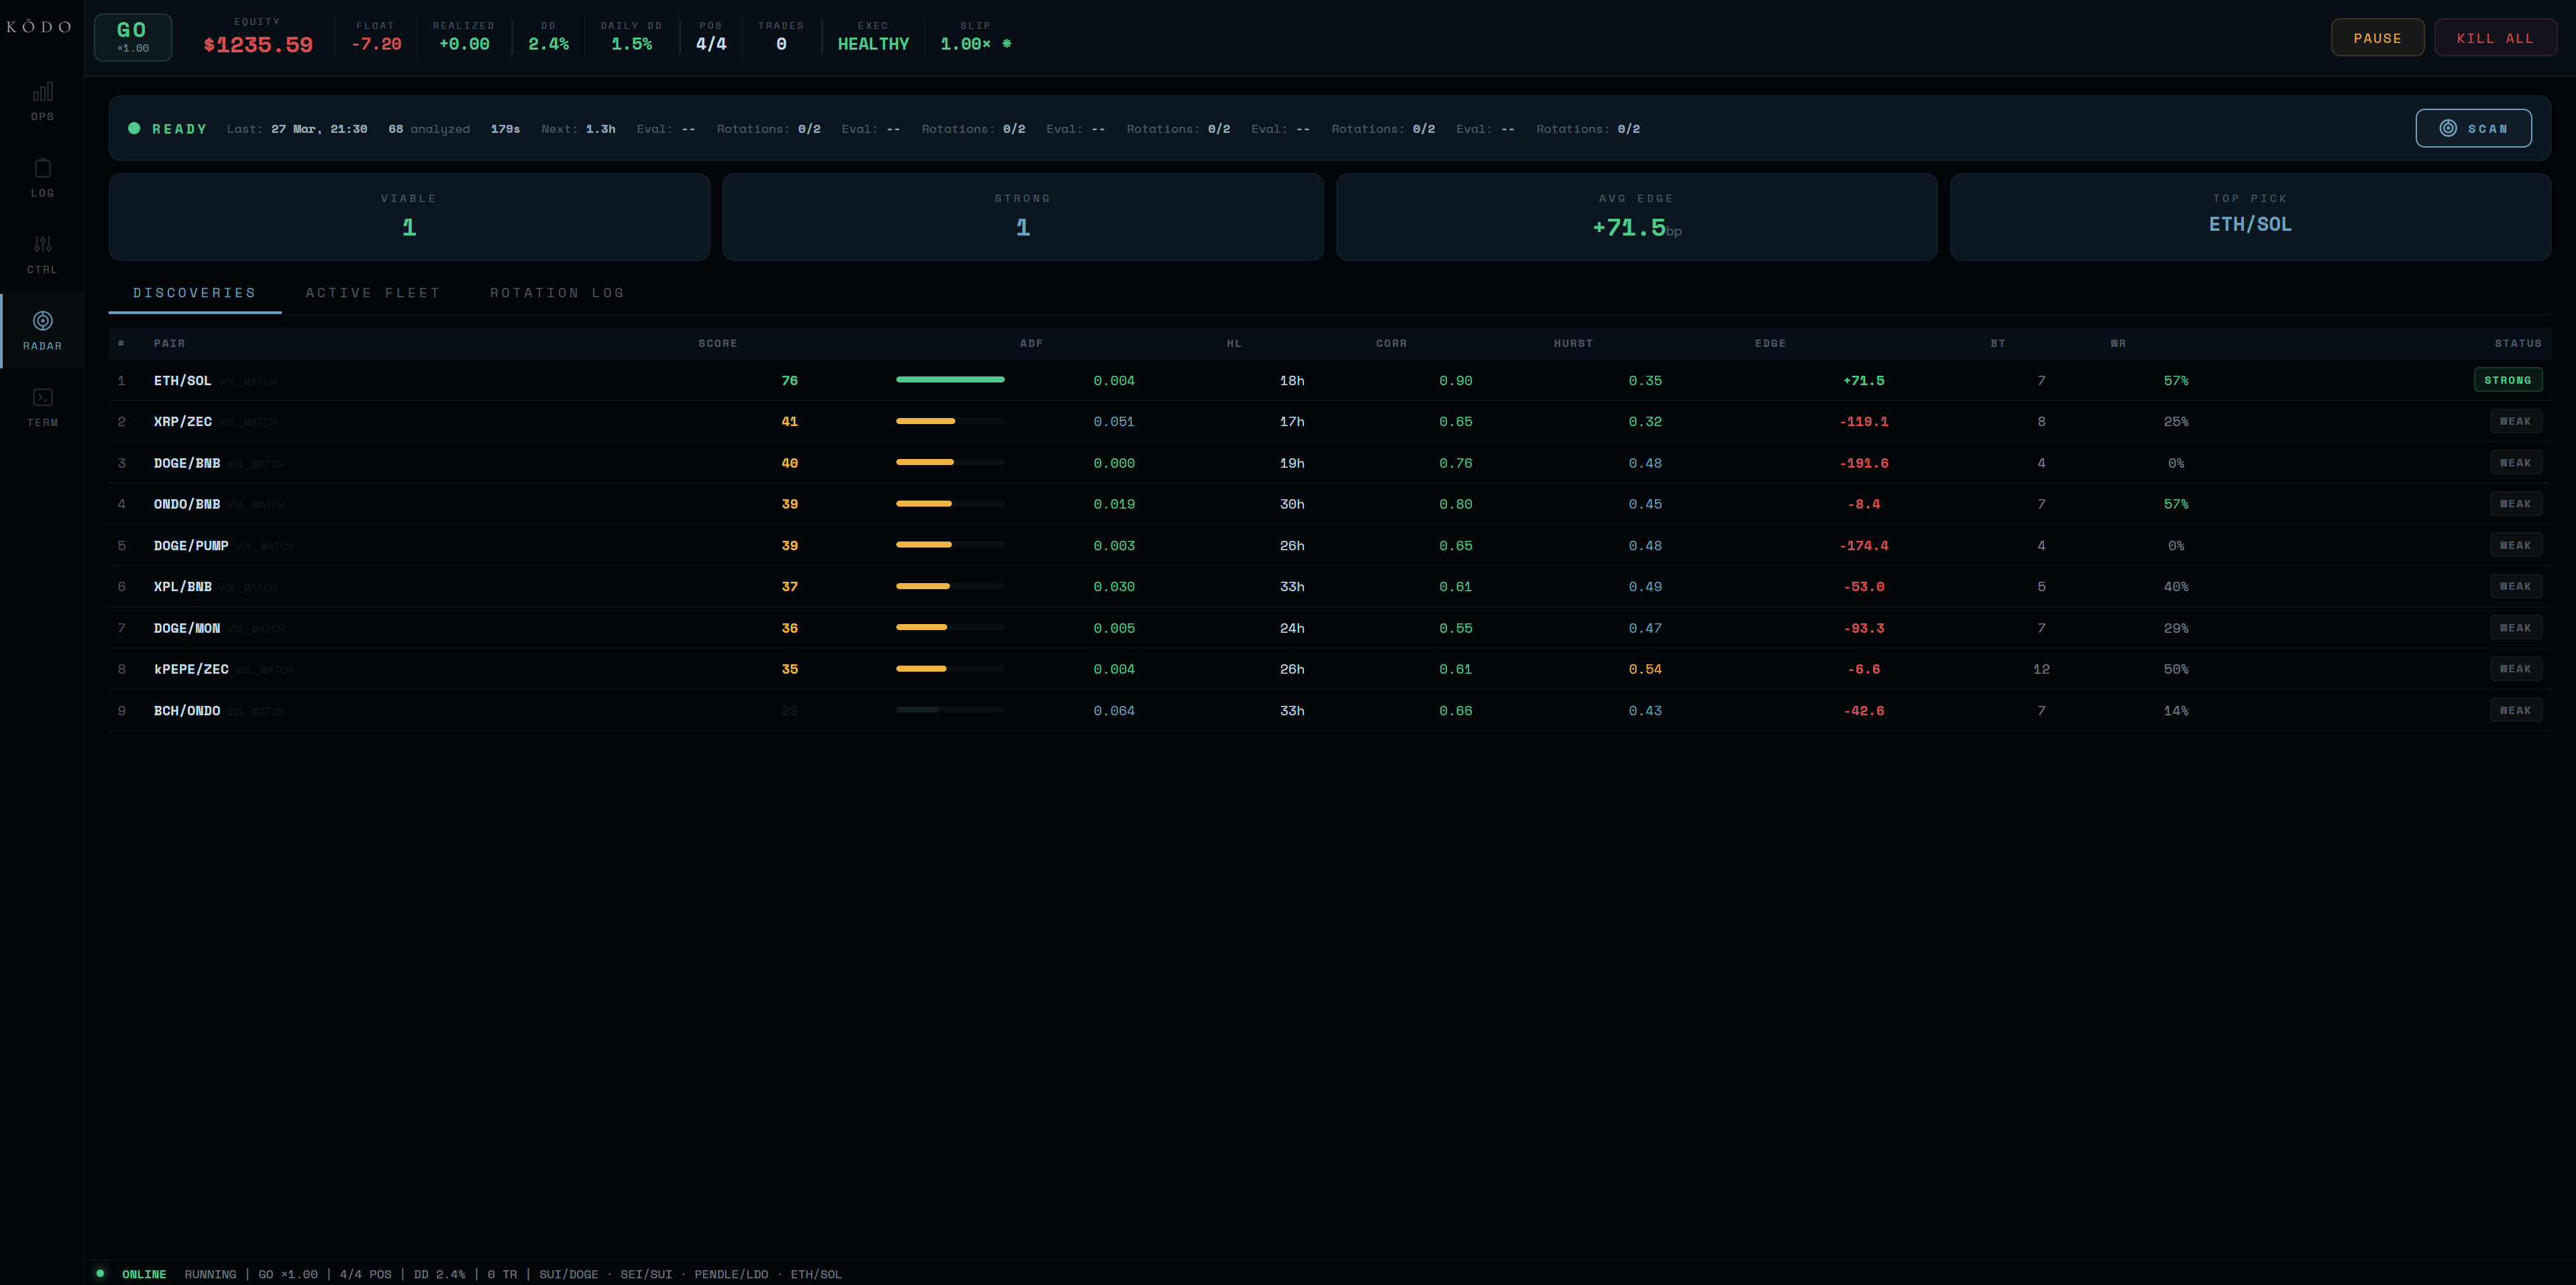
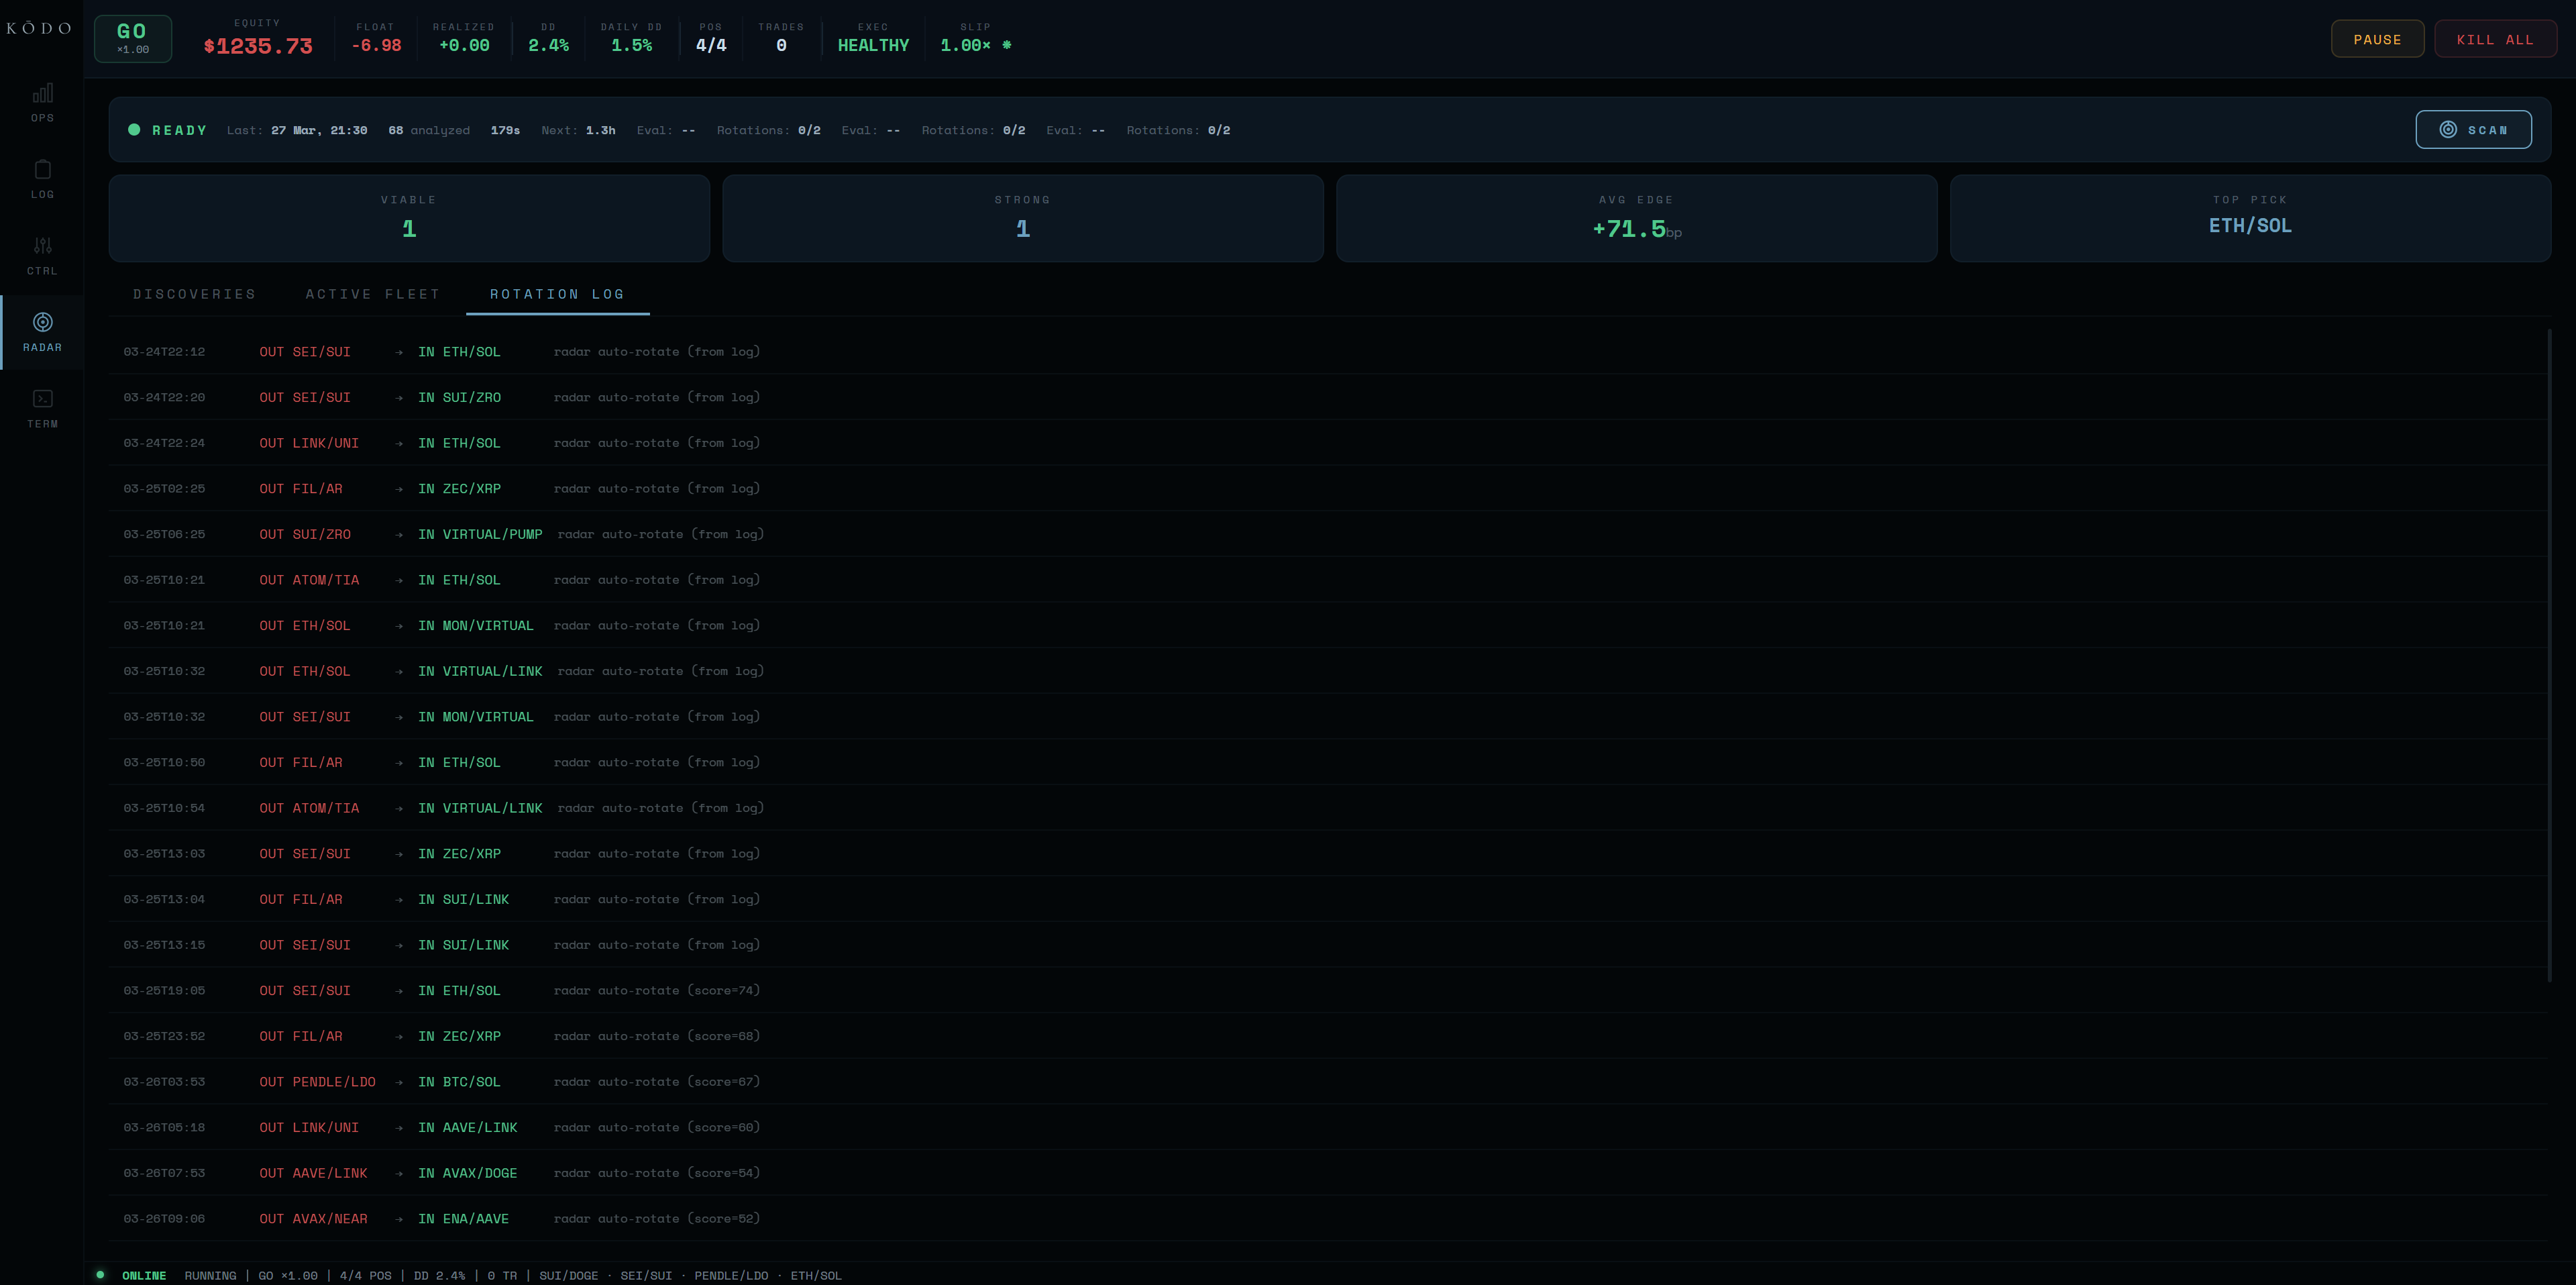
The Pair Scanner: correlation, z-score, half-life, and funding rate across all pairs.
The radar scans 24/7. The operator only sees what matters.
The pair scanner evaluates every pair across four dimensions: correlation coefficient, z-score deviation, half-life, and funding rate differential. Only pairs passing all four filters surface to the operator.
Filter: Suppress weak correlation (<0.7), slow half-life (>48h), adverse funding.
Surface: Only z > 2.4 sigma appears actionable.
Rank: By deviation magnitude. Most urgent at top.
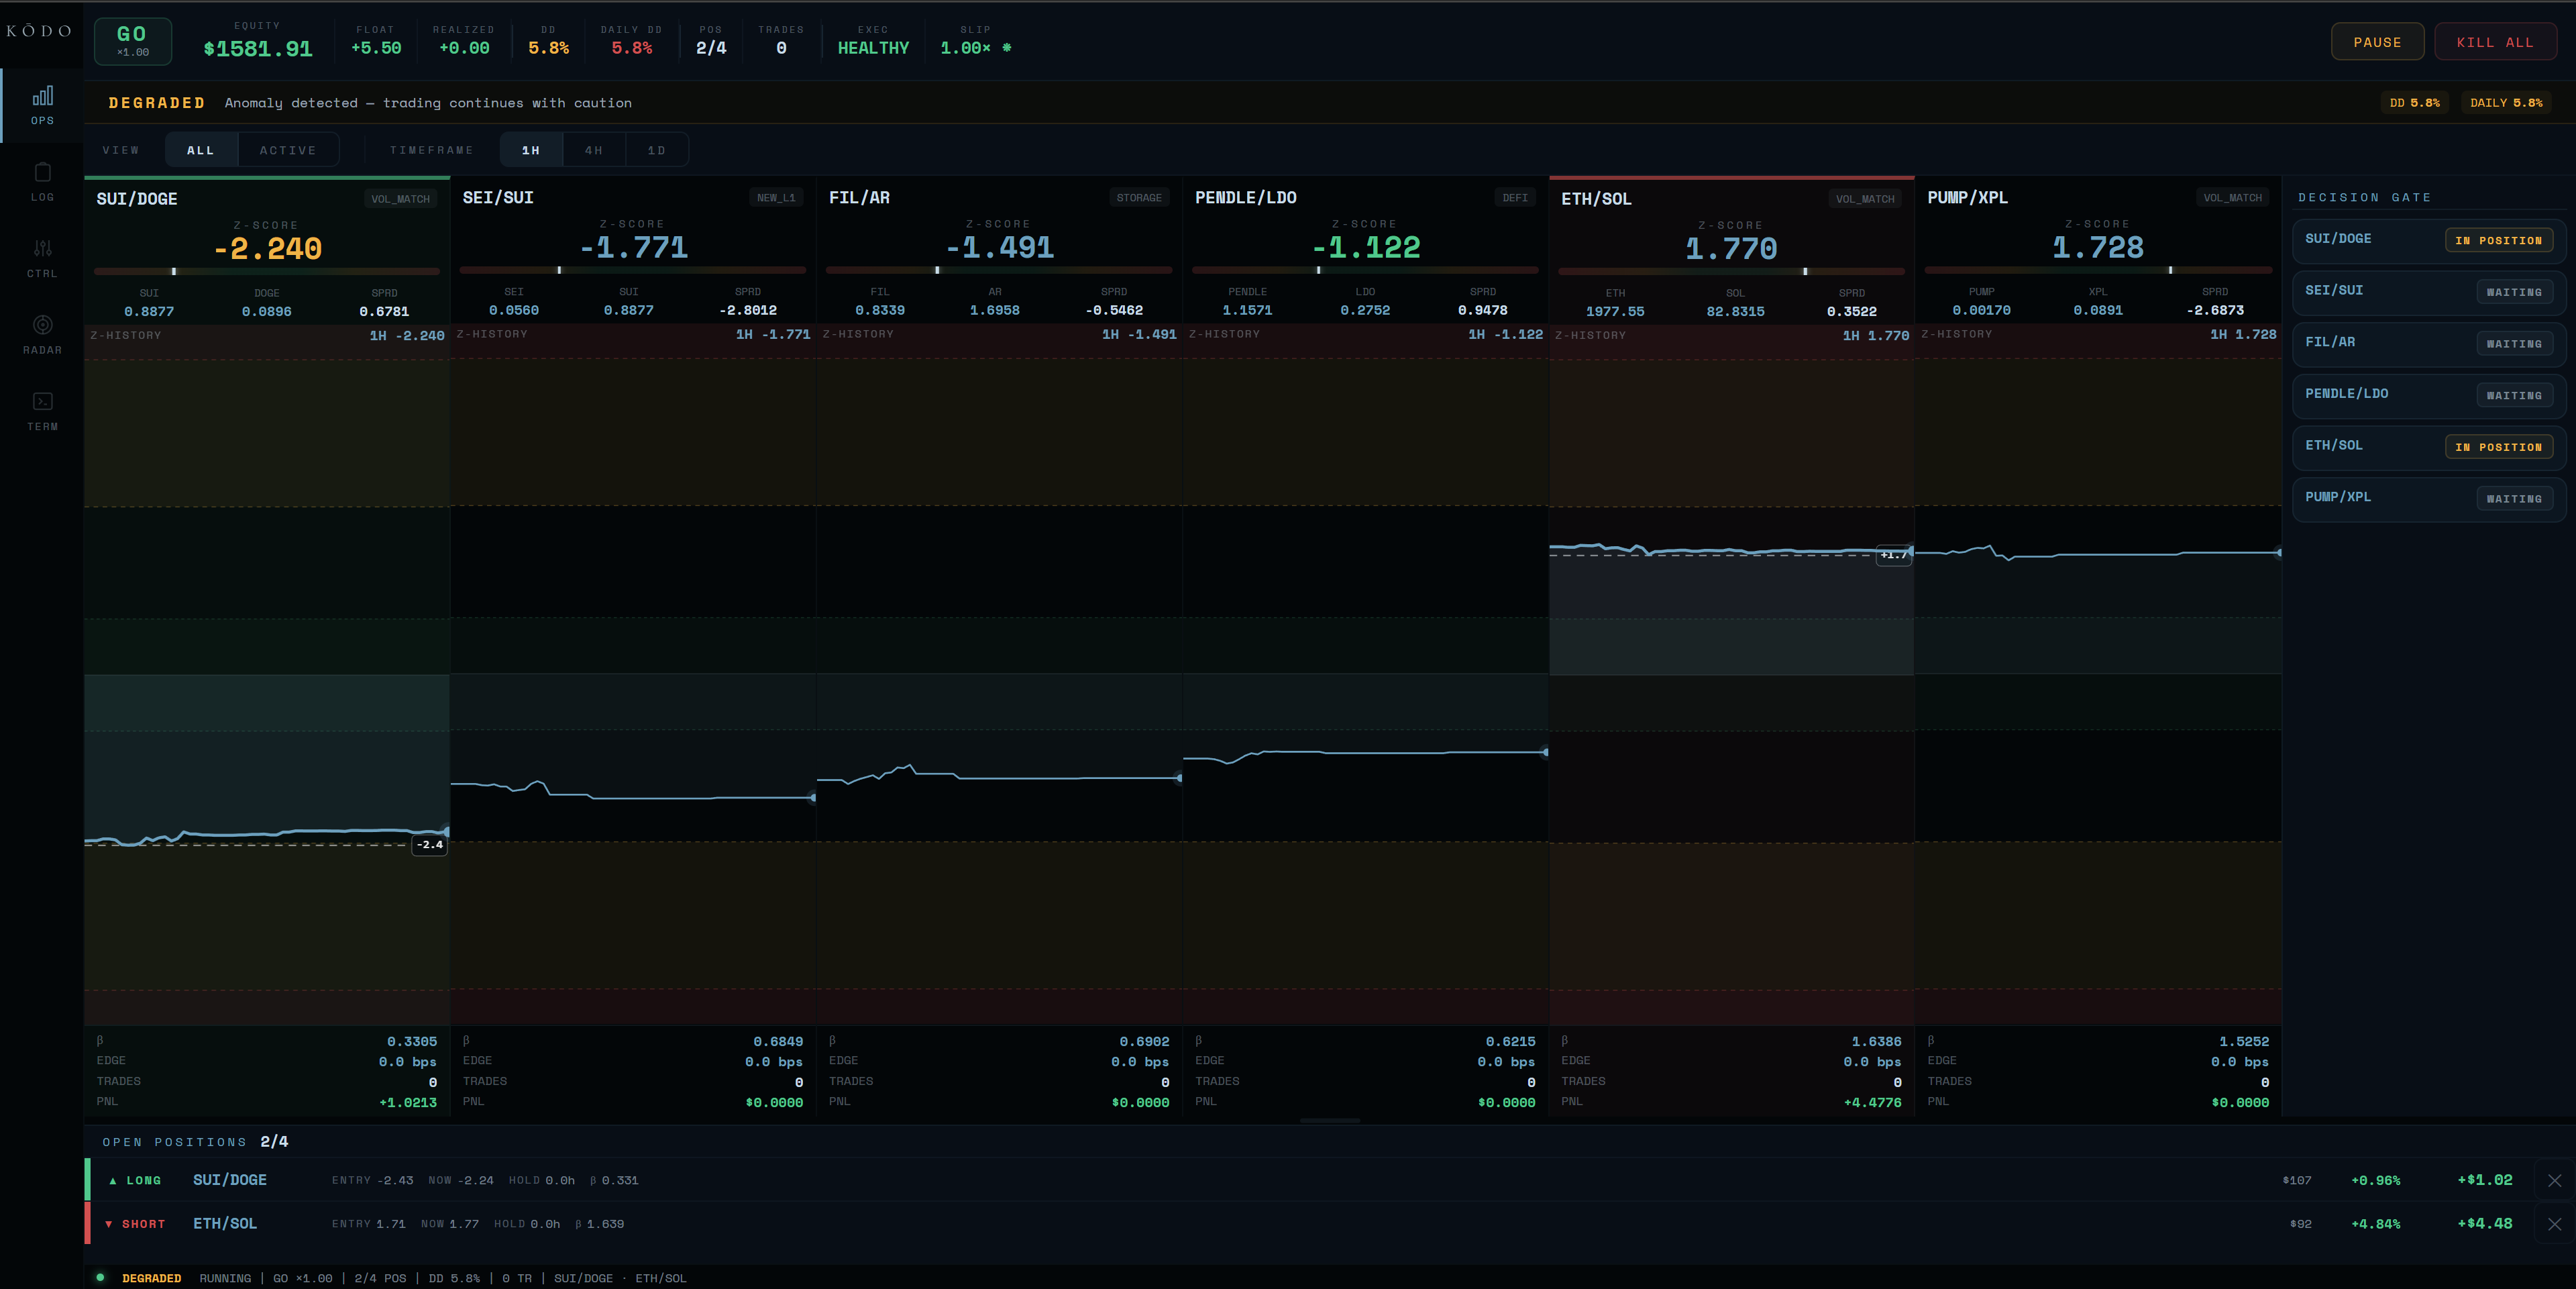
Full radar: 7 pairs monitored. Color-coded z-scores. One screen, not seven.
Three design interventions. From raw data to decision architecture.
1. Designed a 5-layer decision architecture
Signal emergence → validation → decision → execution → survival. Each layer has one responsibility.
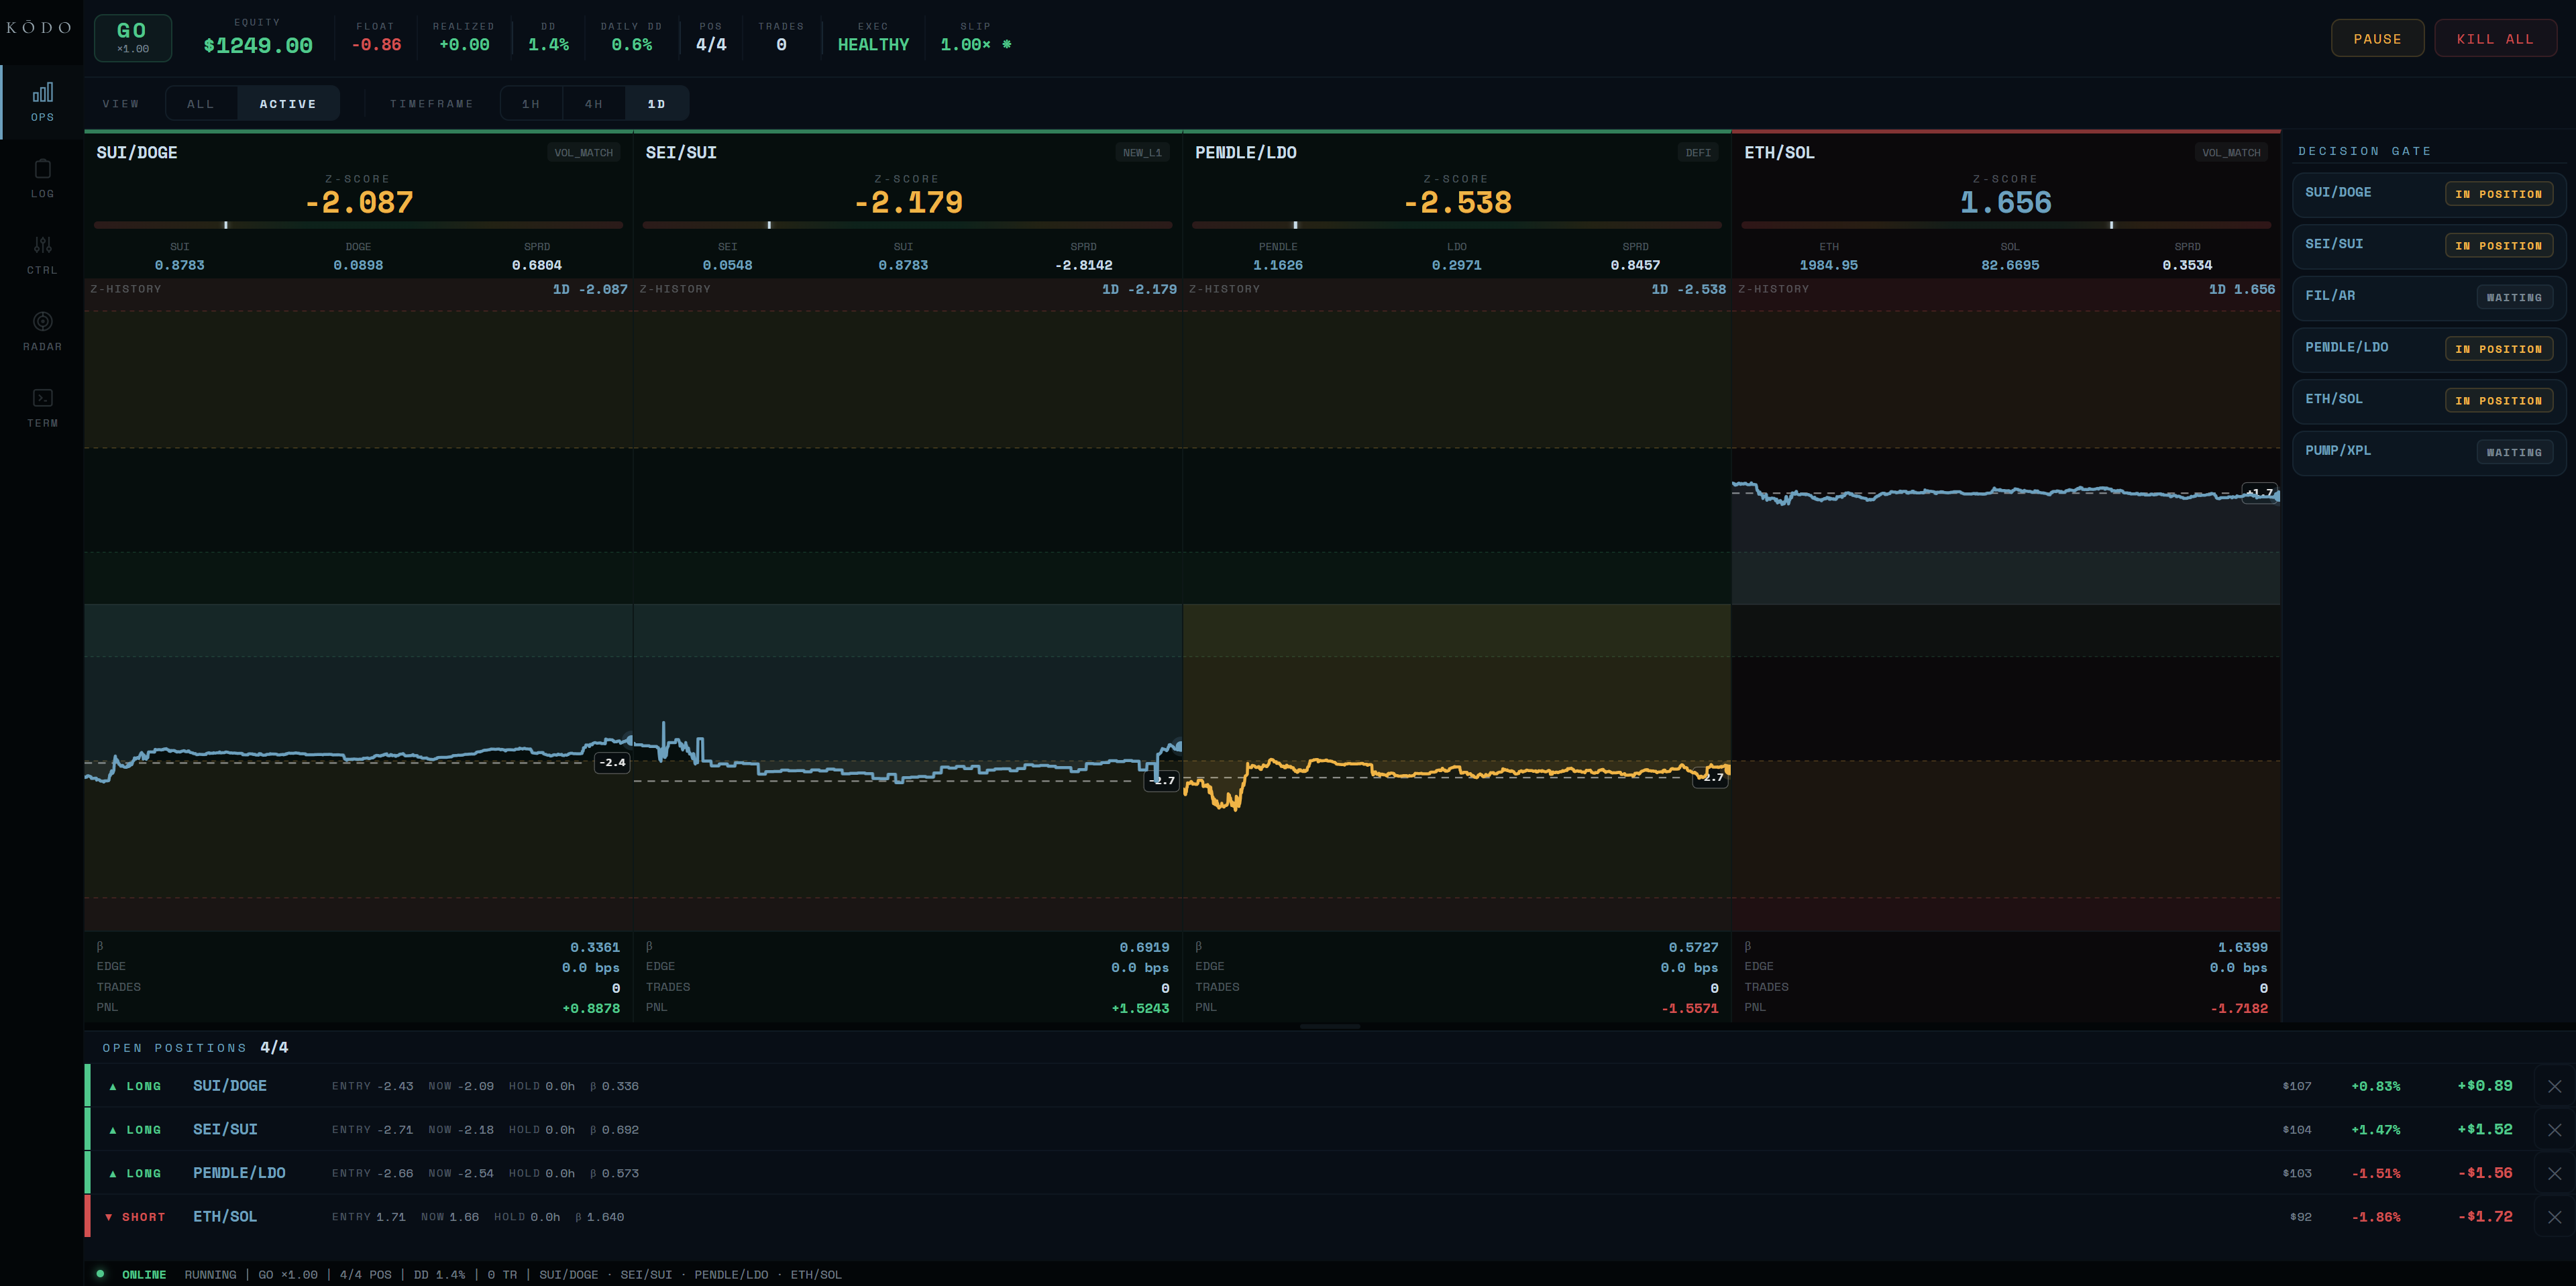
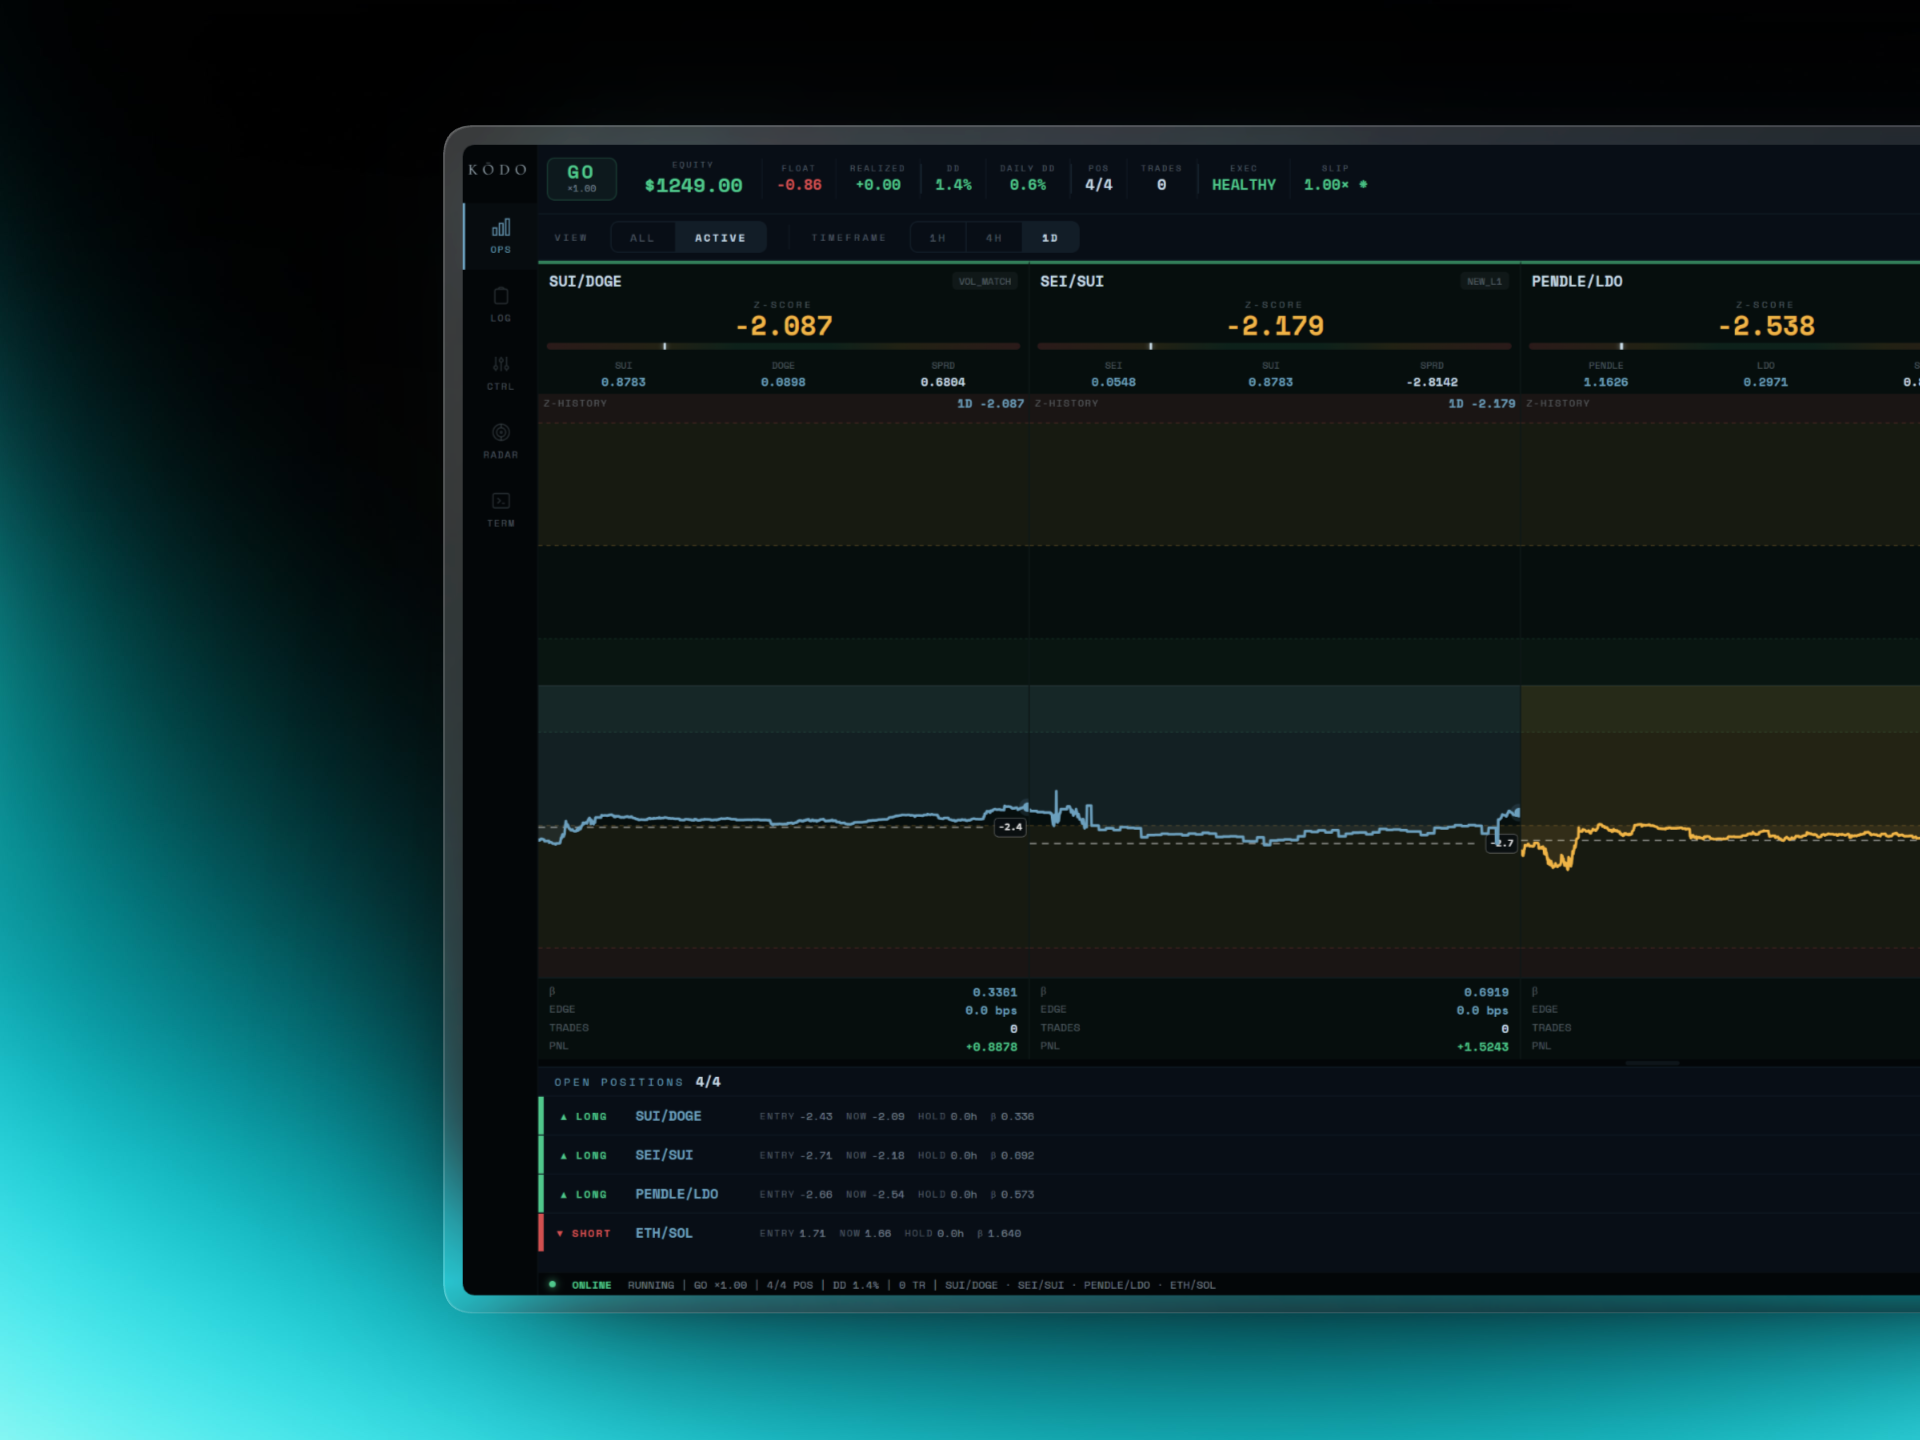
Active state: 5 pairs, spread convergence in real-time. The system entered autonomously and manages toward exit.
2. Five-priority deterministic decision gate
The gate is deterministic. Same inputs, same output. No ambiguity. Higher priorities override everything below.
Drawdown escalation
3. Two operator surfaces: Dashboard + Telegram
Terminal Views
Telegram Command Tiers
95% of interaction is one question answered via Telegram. The 2am interface.
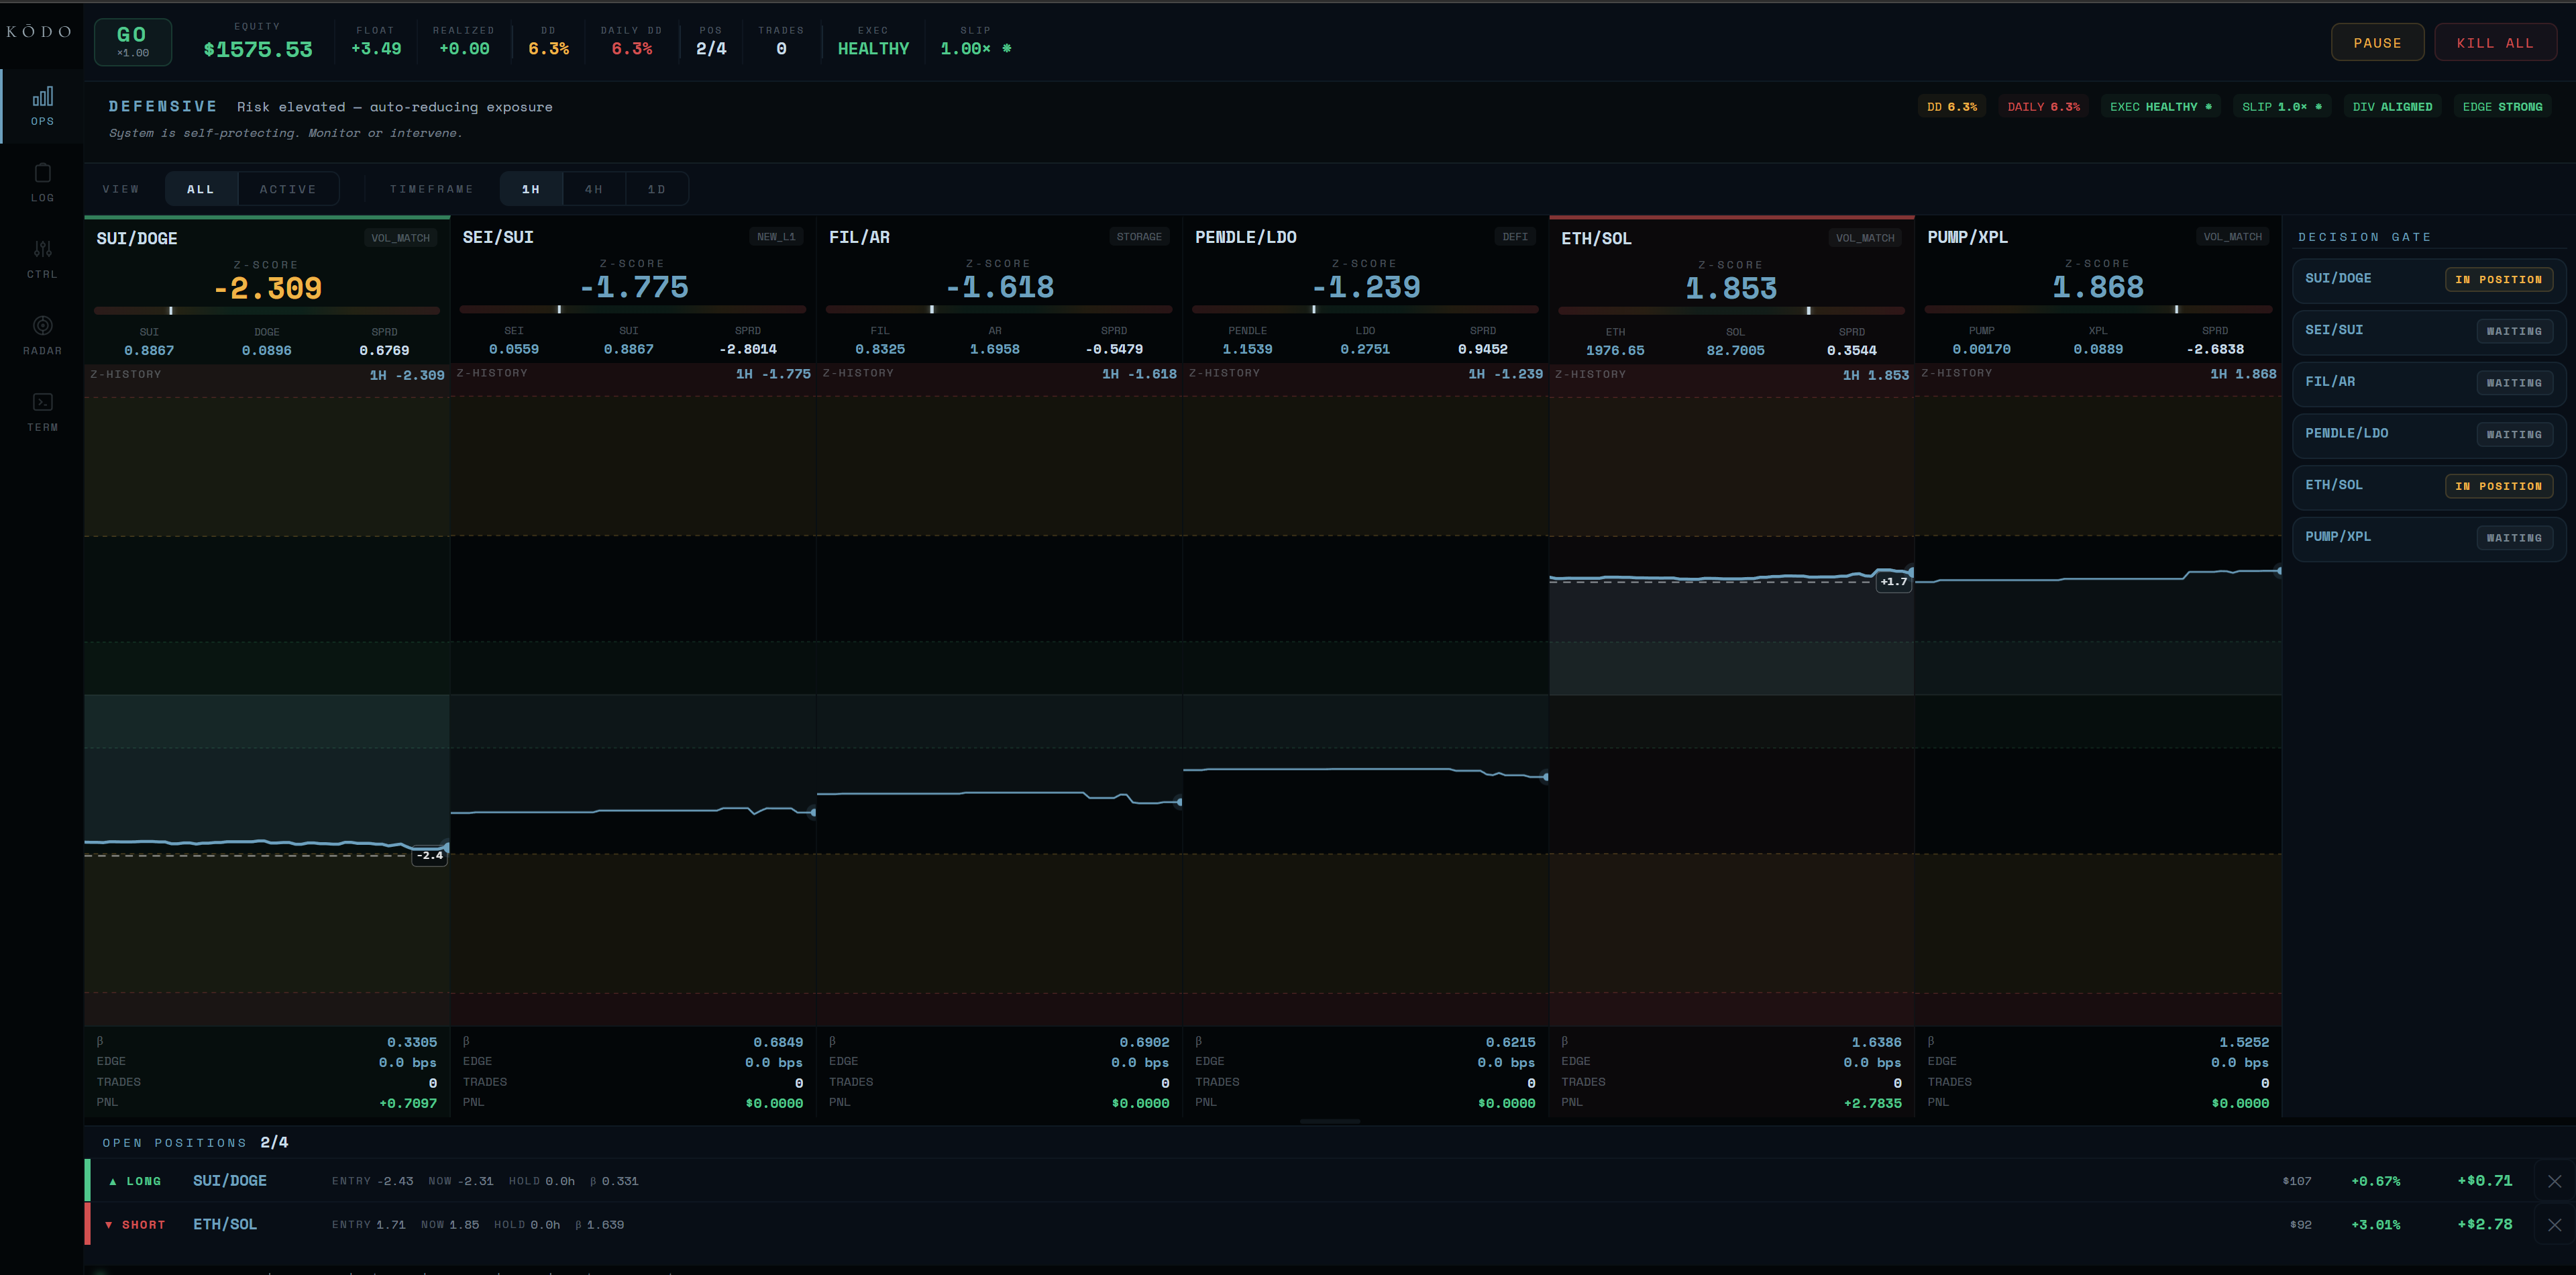
Override state: operator intervened. Risk parameters adjusted. System respects override but keeps monitoring.
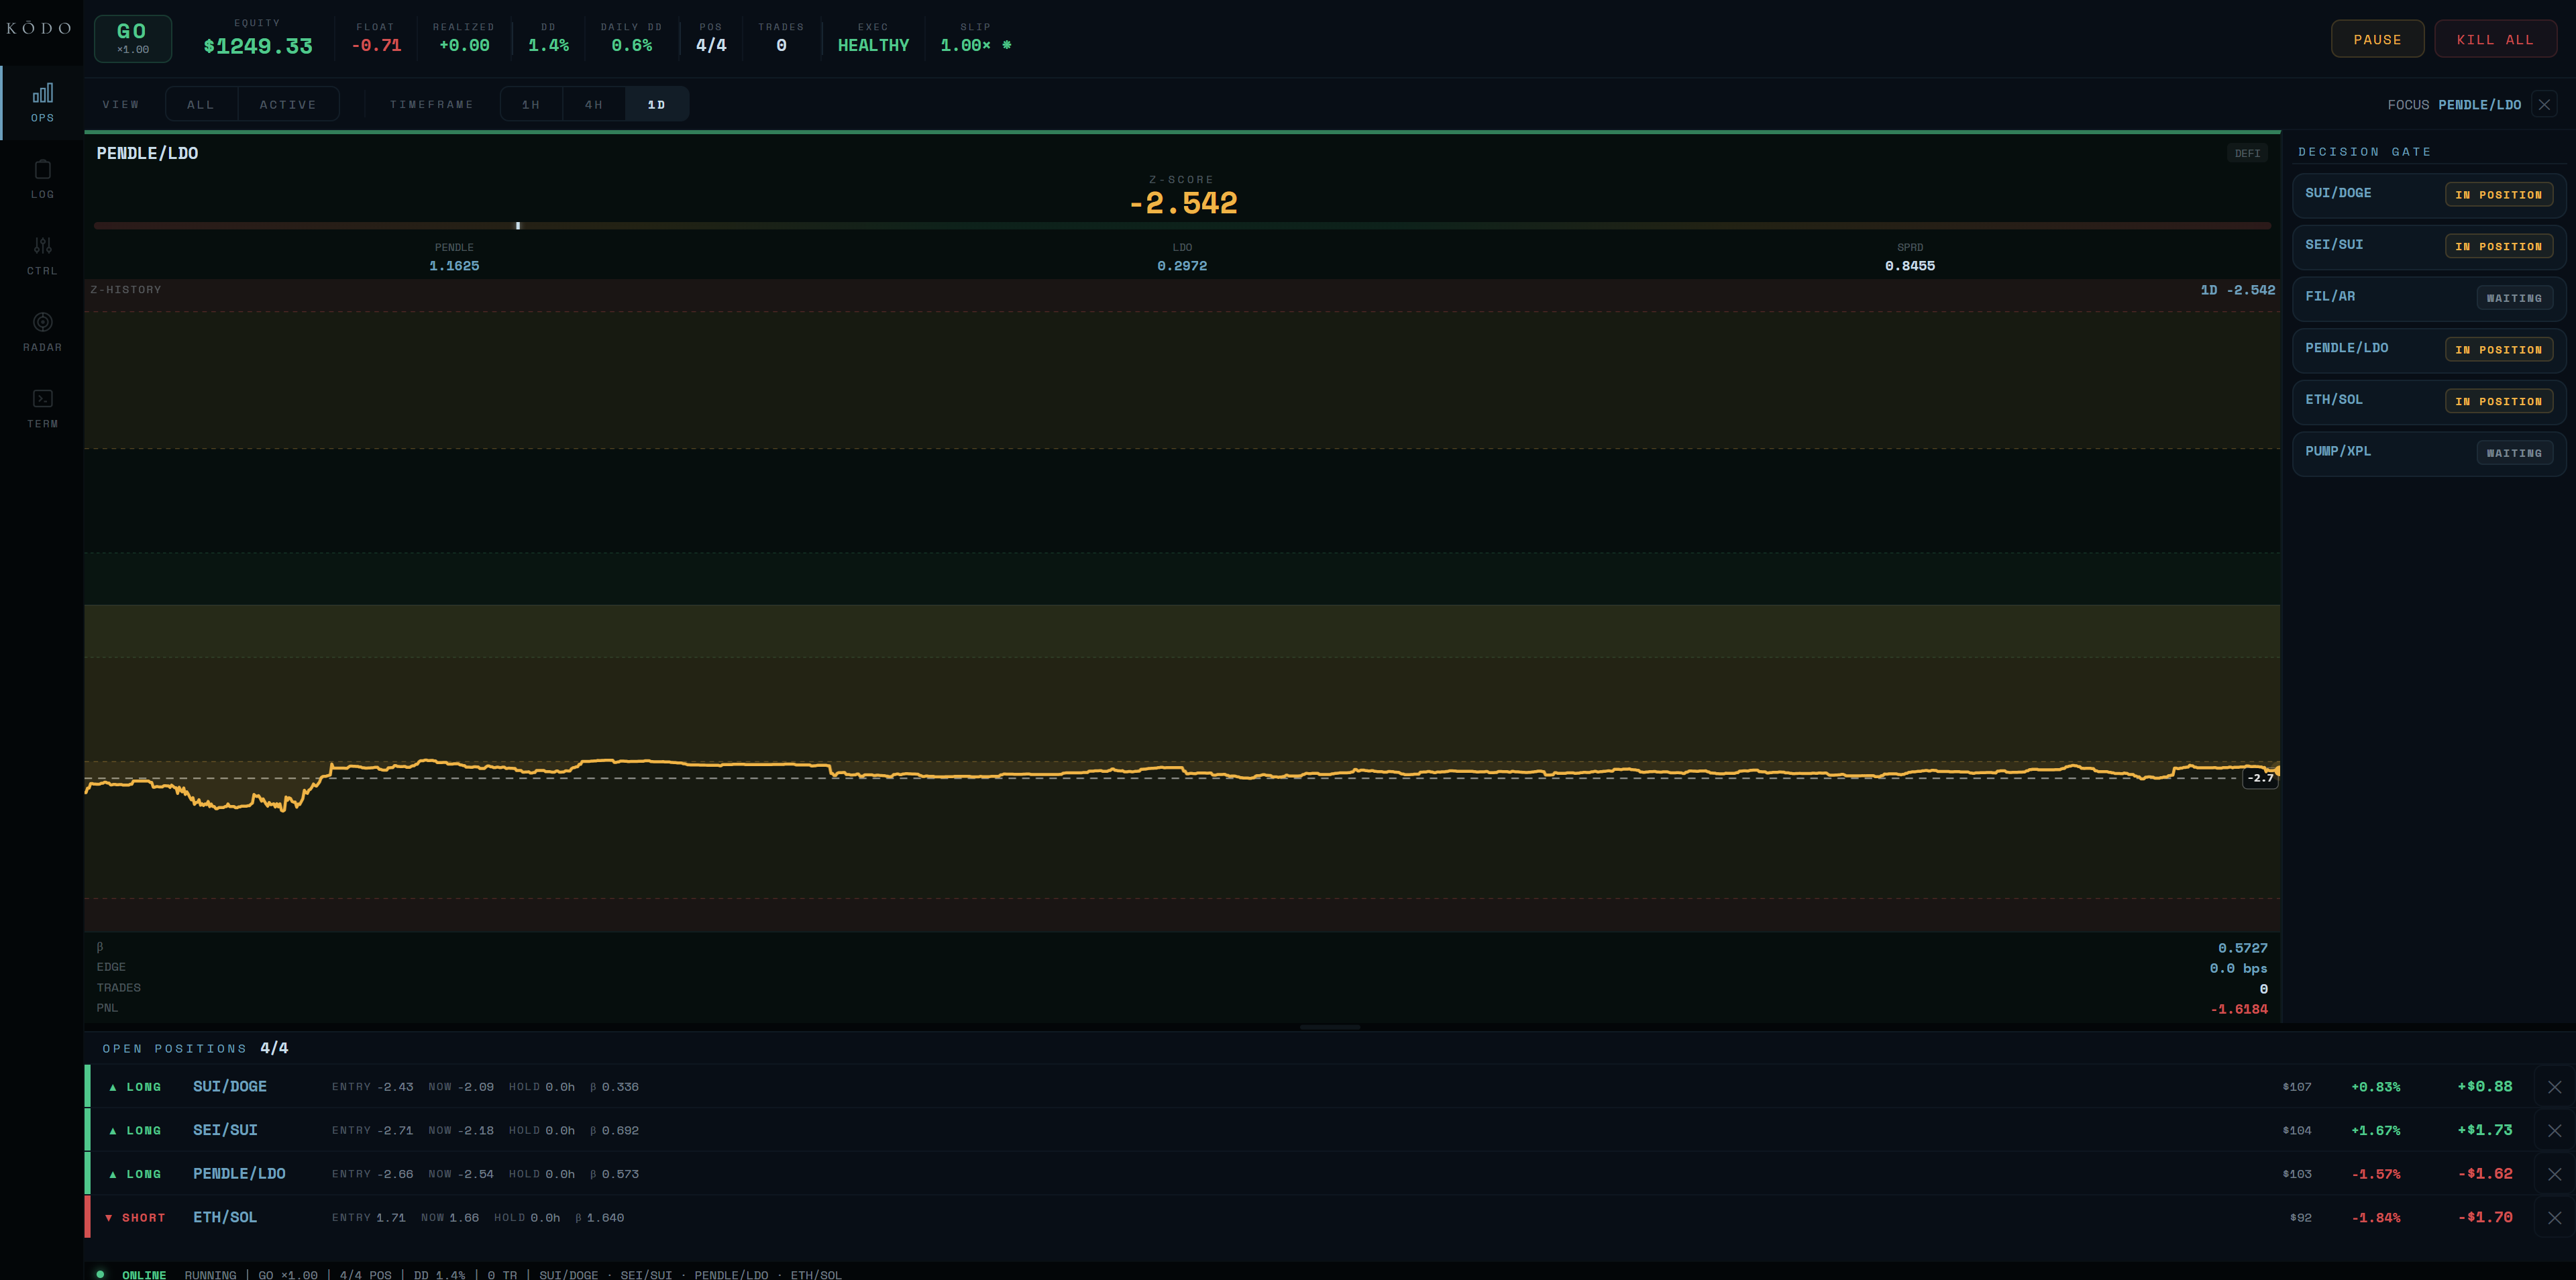
Single pair deep view: full spread history, convergence trajectory.
Trade log: every entry, exit, P&L. Full accountability.
What trade-offs did I make?
Every decision involved choosing between flexibility and determinism under capital risk. These were the most consequential:
| Decision | Chosen | Rejected | Why |
|---|---|---|---|
| Gate logic | Deterministic cascade | Probabilistic model | Under capital risk, "73% confident" is not a useful post-mortem. Hard thresholds = complete traceability. |
| Kill switch | Sticky (manual reset + 10 recovery trades) | Auto-reset | Prevents re-entry after drawdown driven by emotional bias. |
| Primary surface | Telegram | Dashboard | 95% of interaction is "am I okay?" A phone notification answers it in 5 seconds. |
| Infrastructure | Local-only (no cloud) | Cloud deployment | Zero execution latency, complete runtime control. Third-party infra fails at worst possible moment. |
Three surfaces, one decision engine, zero gaps.
KODO operates across three interfaces: the Terminal (full dashboard for deep analysis), Telegram (mobile alerts and quick commands for 2am checks), and Hyperliquid (the on-chain execution layer). A single decision engine sits between all three, ensuring every surface shows the same truth.
KODO Terminal
Flask dashboard. 5 views: OPS (pair radar), LOG (trade history), CTRL (system state), RADAR (pair scanner), TERM (raw feed). Full override controls.
Telegram Bot
3 command tiers: Read (/status, /pairs), Write (/pause, /resume), Destructive (/kill with 2-step confirm). Push alerts for trades, risk events, errors. The 2am interface.
Hyperliquid DEX
On-chain perpetuals exchange. REST + WebSocket APIs. Order placement, position management, funding rate queries. The execution layer KODO talks to.
Pair Scanner
Scans all pairs every 60s. Filters by correlation (>0.7), half-life (<48h), funding rate. Ranks by z-score deviation.
Signal Gate
Deterministic. Entry: z > 2.4σ. Exit: z < 0.8σ. Stop-loss: z > 4.5σ. Same inputs always produce same output. Zero discretion.
Risk Manager
Position sizing based on account equity. Max 3 concurrent. Drawdown escalation: Normal (0-6%), Reduced (6-9%), Blocked (9-10%), Kill (>10%).
Executor
Two-leg order placement on Hyperliquid. Long leg + short leg. Slippage monitoring. Execution latency tracking per order.
Kill Switch
Priority 1. Sticky (manual reset only). Close all positions. Halt all new entries. 2-step confirmation via Telegram. Cannot be overridden by automation.
Price Feed
Hyperliquid WebSocket. 60-second aggregated ticks. Mid-price calculation. Rate-limit managed.
Spread Calculator
Log-price ratio between pair legs. Rolling window statistics. Kalman filter for noise reduction.
Z-Score Engine
Mean and standard deviation over rolling window. Non-stationary adjustment. The single number that drives every decision.
Funding Monitor
Rate differential between pair legs. Carry cost calculation. Adverse funding triggers pair suppression.
Reconciler
Runs every 5 ticks. Compares local state vs on-chain positions. Fixes phantom positions from network timeouts. Non-negotiable in DeFi.
System States
4 states: OPEN (normal ops), REDUCED (half size), BLOCKED (entries stopped), KILLED (all closed). Auto-escalation based on drawdown %.
Shadow Trader
Runs model in parallel without executing. Compares theoretical vs actual P&L. Divergence threshold: $0.30/trade. Flags model drift.
Edge Tracker
Decomposes trade-level P&L into signal edge, execution cost, slippage, and funding. Identifies which pairs actually produce alpha.
Position Limits
Max 3 concurrent positions. Max 5 pairs monitored. 7x leverage cap. Per-pair allocation proportional to edge score.
Trade Attribution
Every trade logged with: entry/exit z-scores, hold duration, P&L, slippage, funding cost, execution latency. Full accountability.
Parameter Tuning
Edge tracker data feeds back to signal model. Half-life windows adjusted. Entry/exit thresholds refined. Pairs added/removed based on real performance.
Cycle Restart
Updated model. Refined parameters. Cycle restarts every 60 seconds. The system that runs today is better than the one that ran yesterday.
Every scenario the system was designed for.
The map below traces six critical operator scenarios across three layers: what the operator experiences, what the system does autonomously, and where the operator surface (Terminal or Telegram) sits in the flow. Each scenario was designed for the worst version of itself.
Design goal: this entire interaction takes <5 seconds. One glance. One answer. If the system is healthy, the operator's job is to go back to sleep.