CompanyEnso Coliving, 2025
RoleProduct Design Lead
Key outcome+34% booking conversion
Product Design / Conversion / PostHog

Turning vacancy risk into conversion urgency

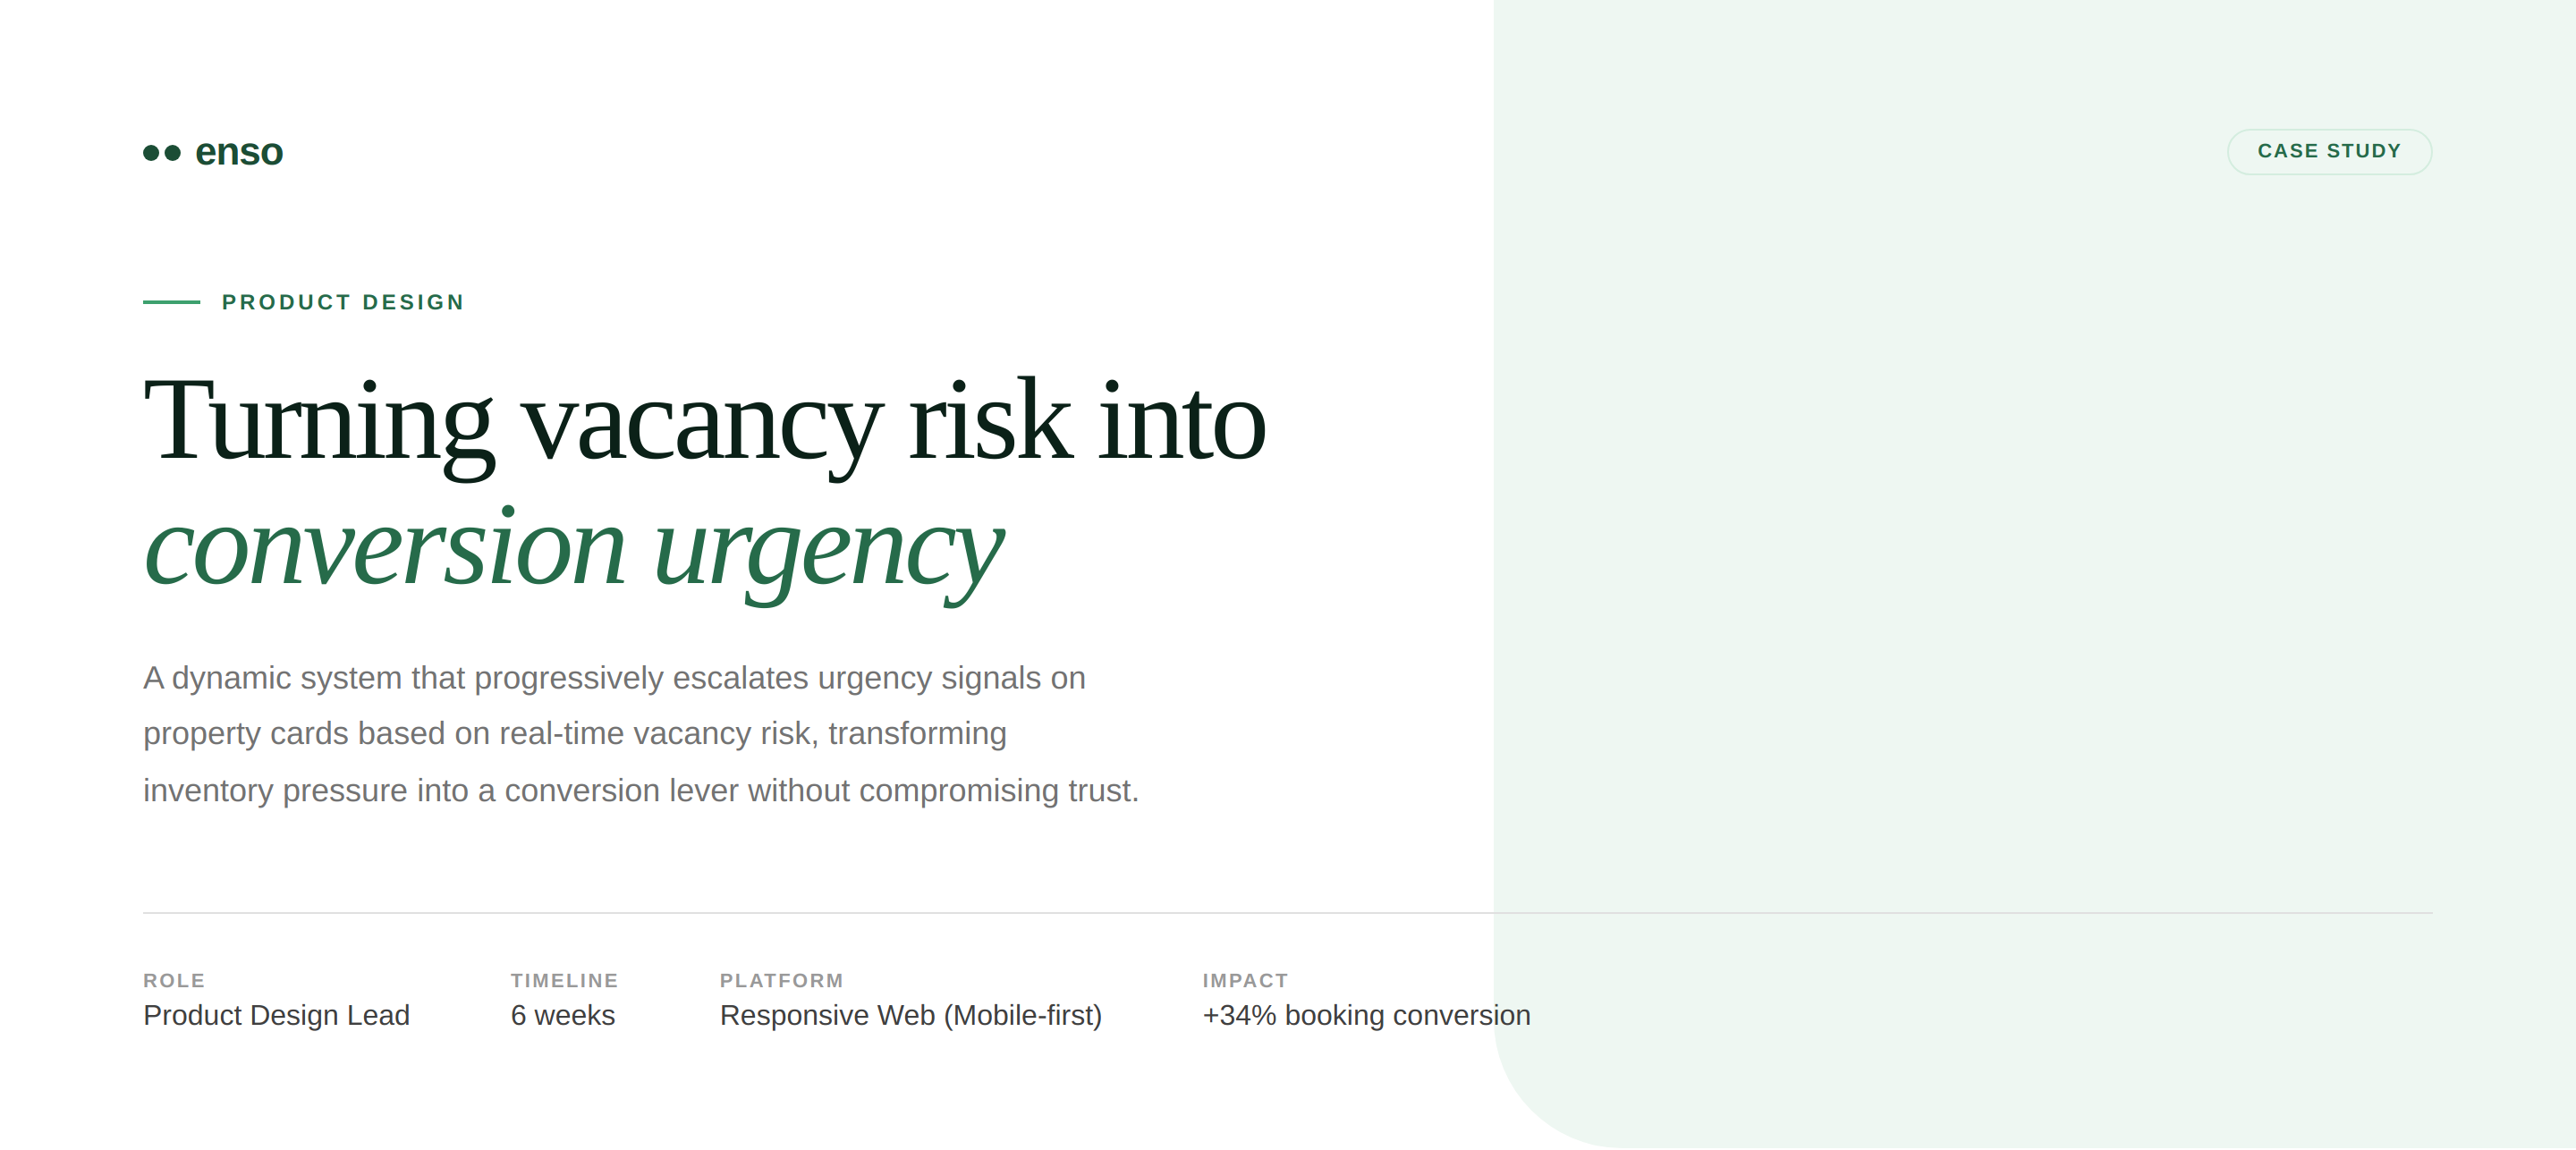
Every empty habi costs Enso ~4.2K€/month. Our listing cards were static: a room available tomorrow looked identical to one available in three months. We built a dynamic system that progressively escalates urgency signals based on real-time vacancy risk, driving action without feeling manipulative.
+34%Booking conversion rate
14,208Users in the A/B test
5Card levels shipped
Case study cover
01 Problem

Every empty room is burning money

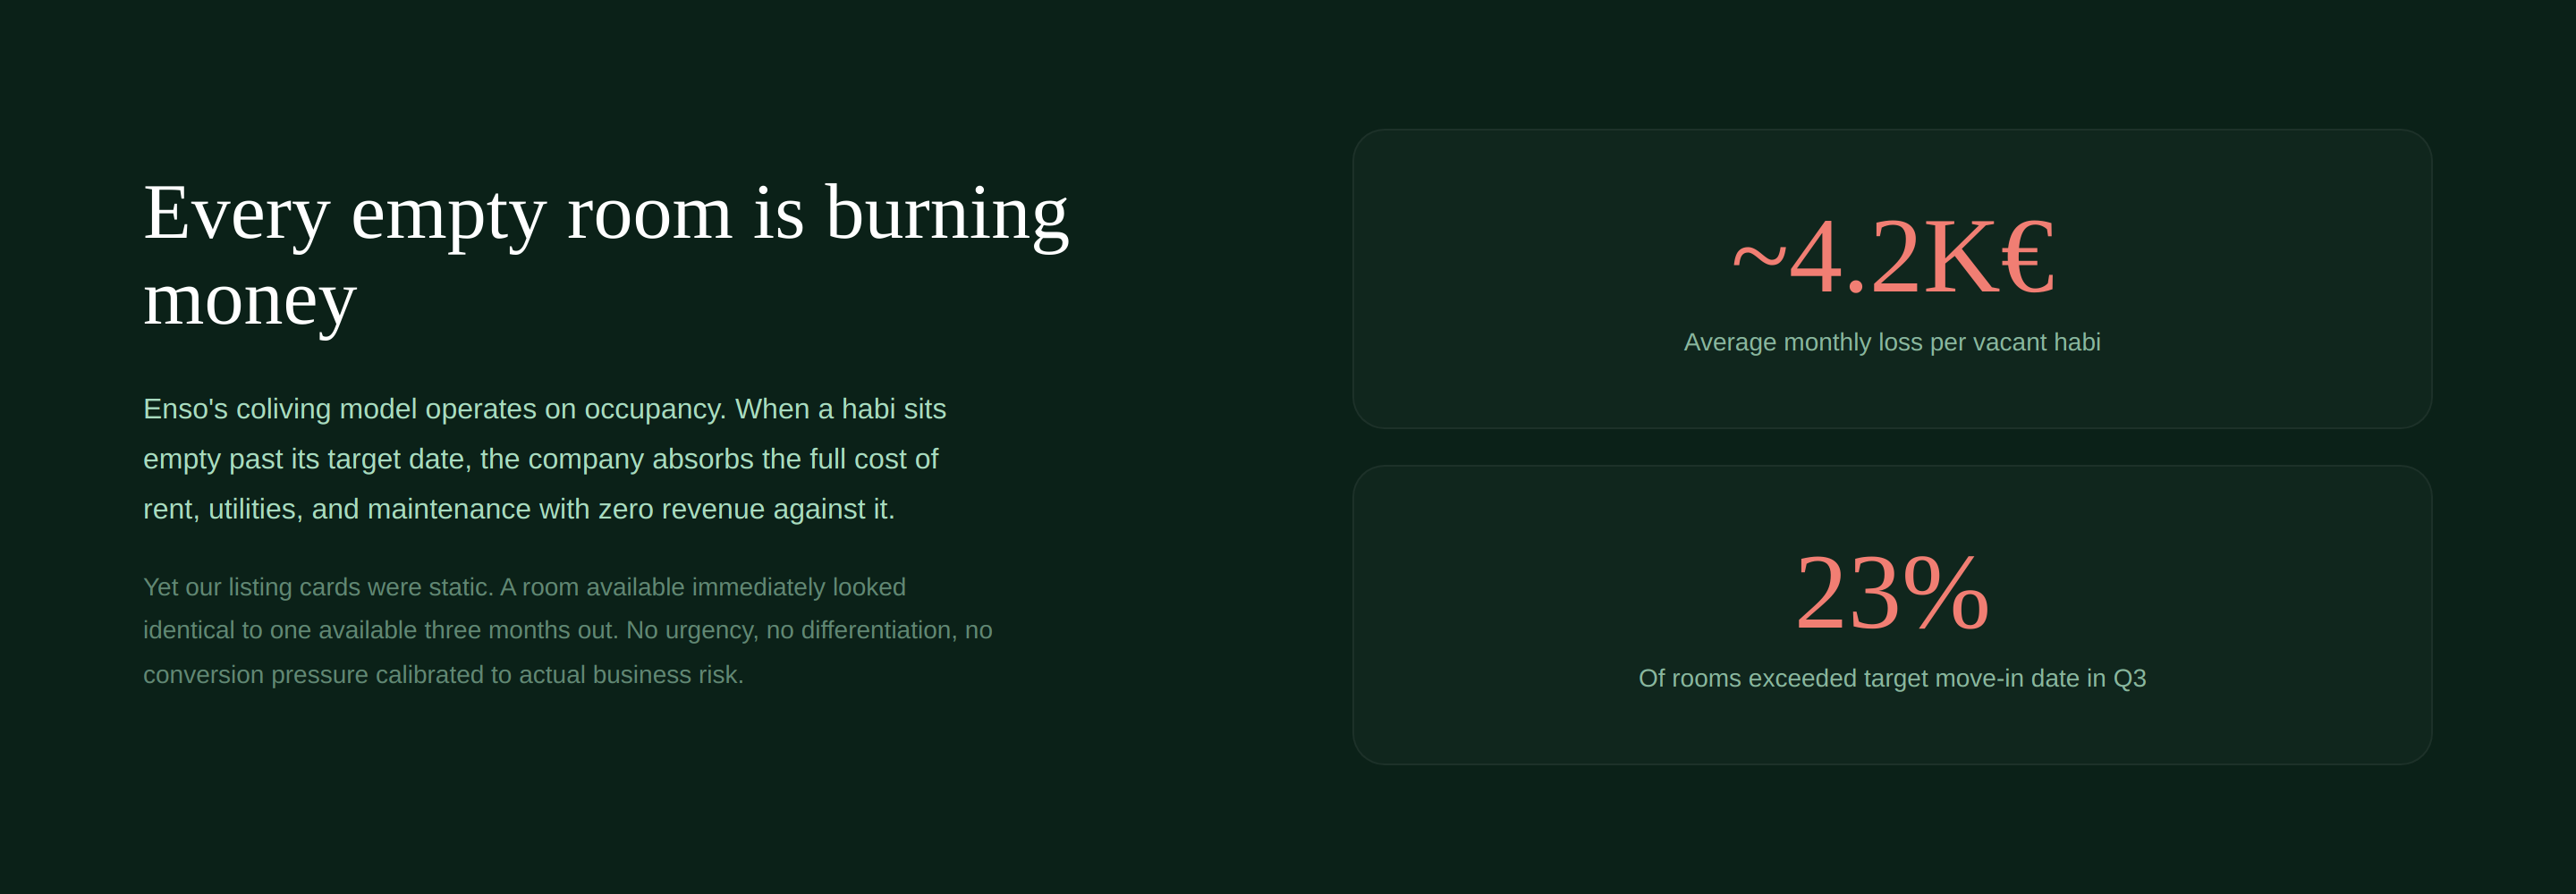
Enso's coliving model operates on occupancy. When a habi sits empty past its target move-in date, the company absorbs rent, utilities, and maintenance with zero revenue. In Q3 alone, 23% of rooms exceeded their target date.

The core issue: our listing page treated every room equally. A high-risk vacancy that needed to fill this week displayed the same card as a room available three months out.
HypothesisIf we surface the right urgency signals at the right time, we can accelerate bookings for high-risk inventory without degrading trust.
Problem statement
02 Approach

Design principles for ethical urgency

Urgency design is a minefield. Booking.com-style dark patterns erode trust. We needed a framework that drove action while remaining honest.

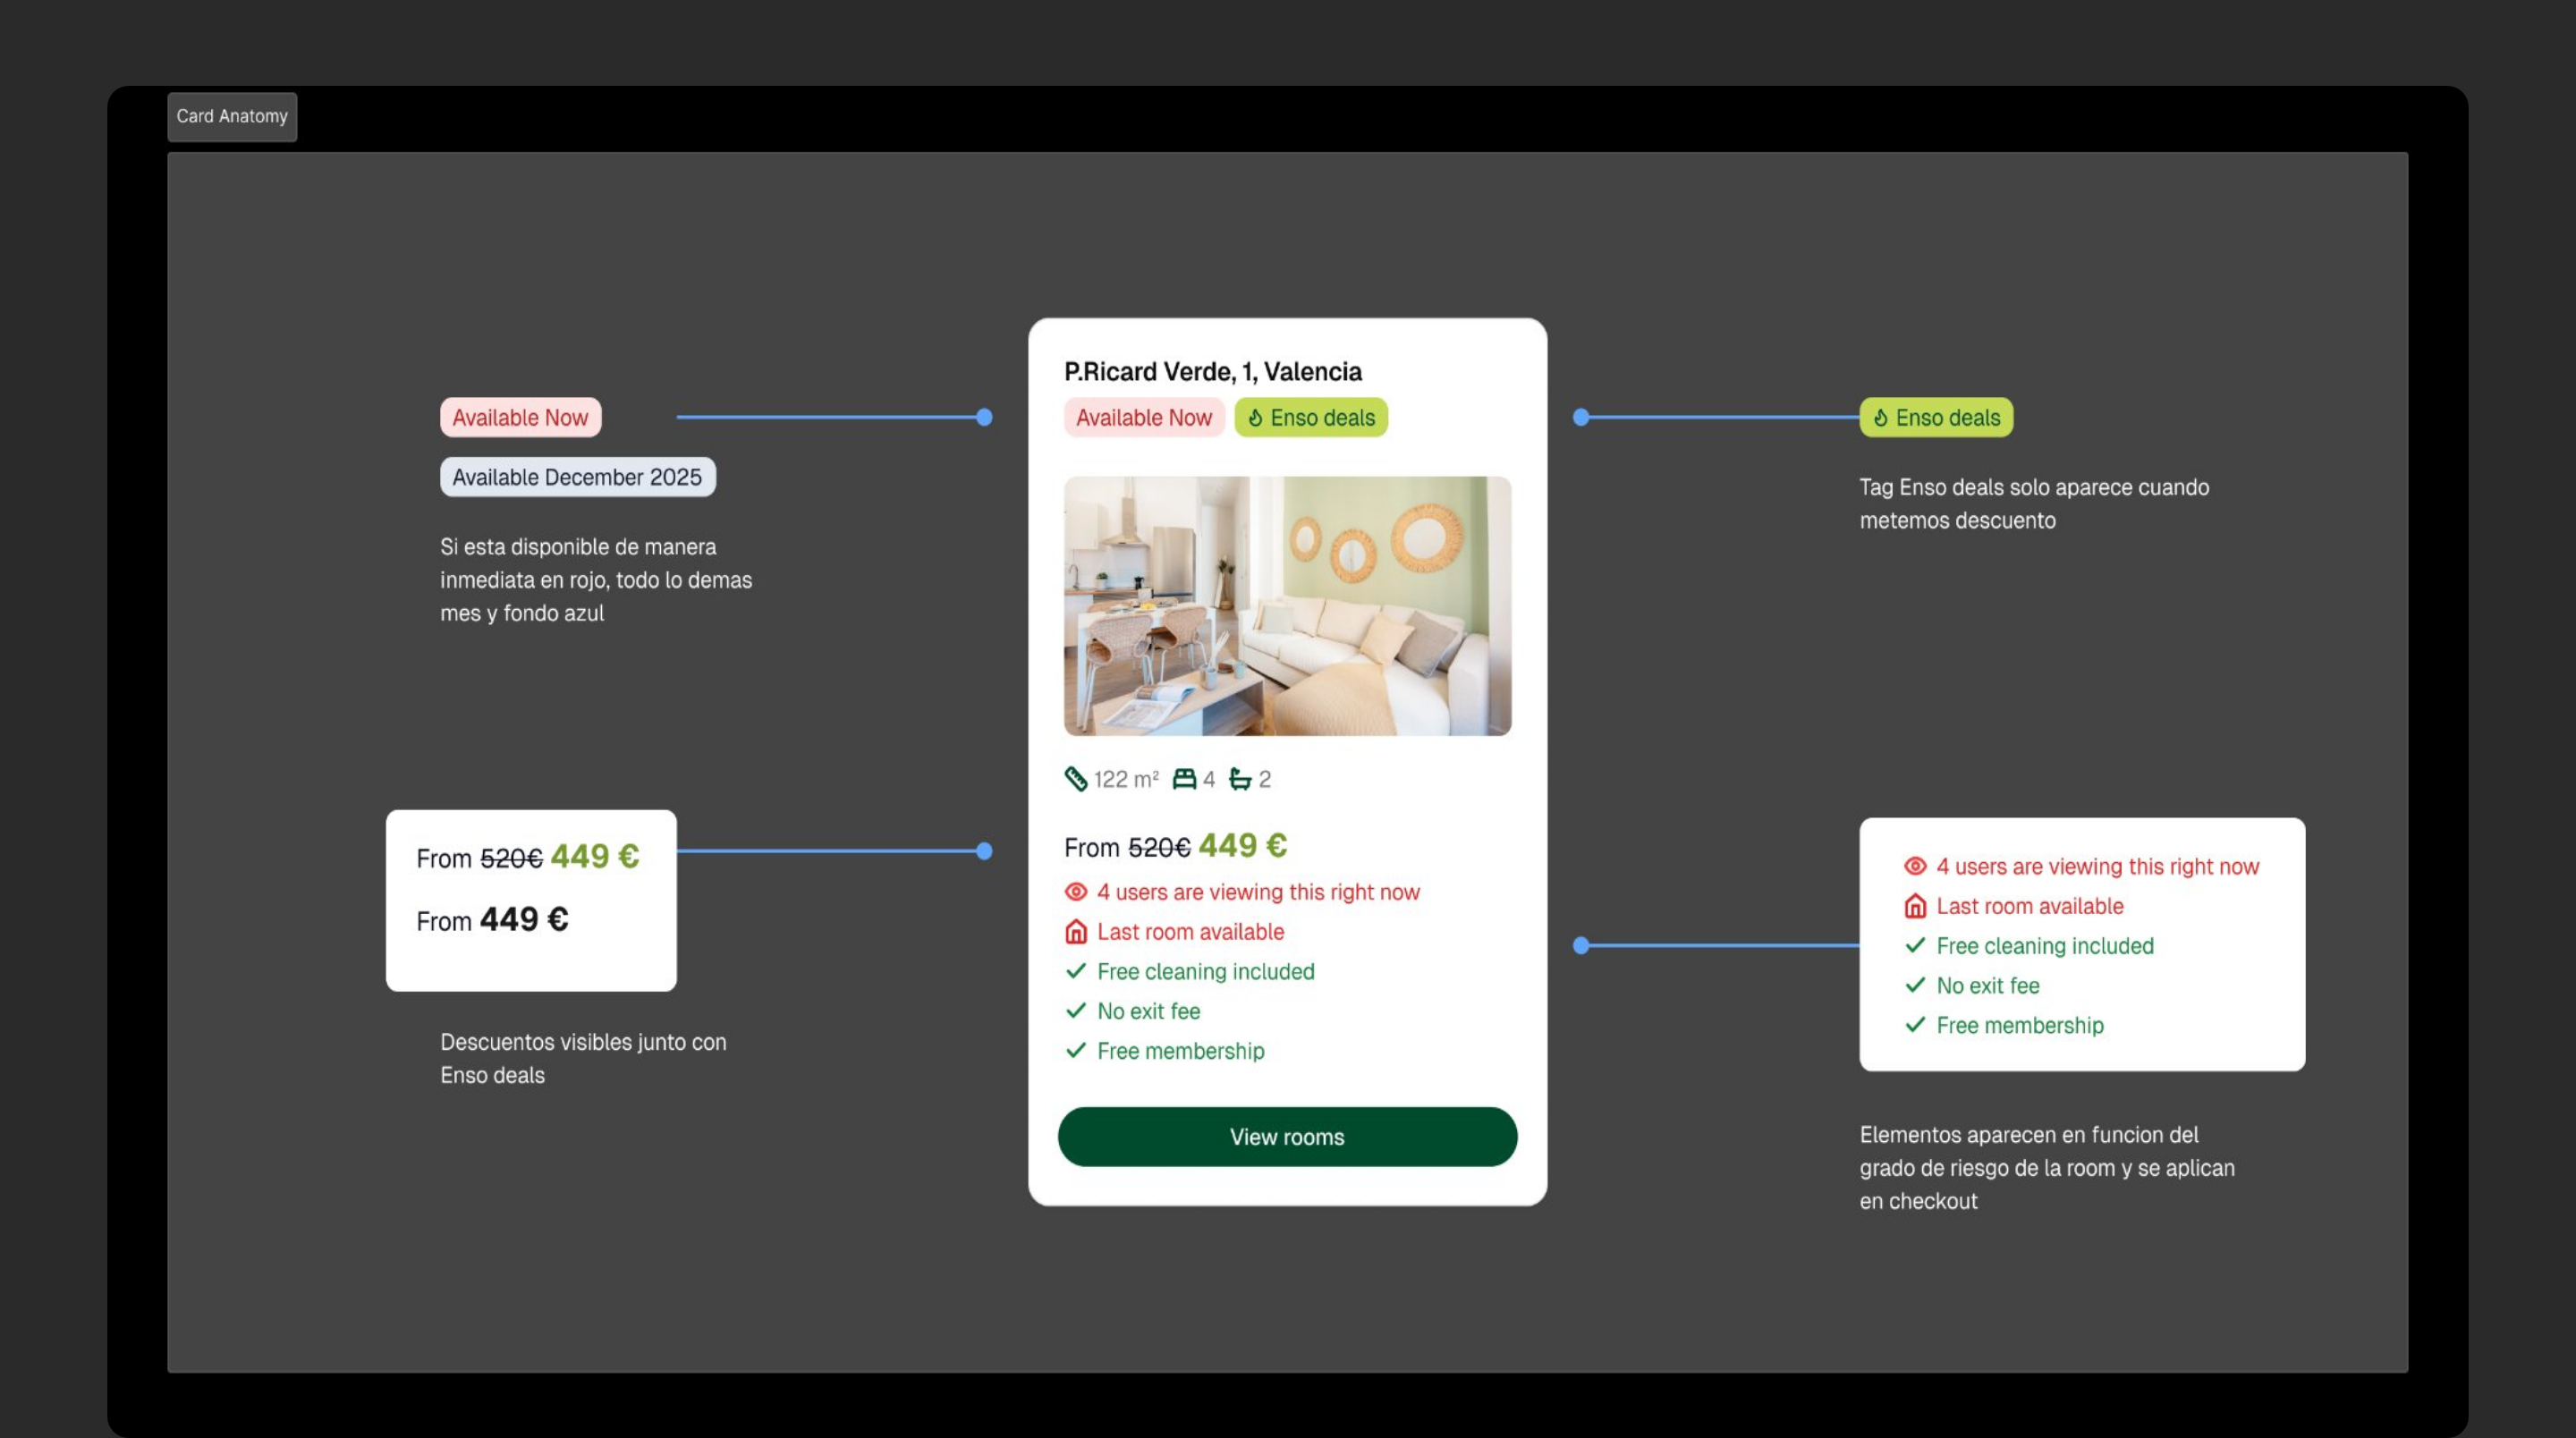
Design rationaleProgressive disclosure: start clean, only add elements when business risk justifies them. Availability dates, discounts, perks and last room tags reflect the room’s real situation. The user decides. We surface context. We never manufacture panic.
02b Service Blueprint

How the system works across layers

The urgency system operates across four layers: the user-facing experience, the business logic engine, the data pipeline, and the operational feedback loop. Each layer feeds the next.

User Experience Layer City Landing Browse listings Card grid + filters Card Impression Risk-calibrated UI Urgency signals render Room Detail Deal perks confirmed Gallery + amenities Checkout Perks in summary Price breakdown Booking Confirmation Occupancy +1 Business Logic Layer Risk Calculator Per-room scoring Days to target date Current occupancy rate Tier Assignment L1: >30 days (calm) L3: 7-14 days (deals) L5: overdue (max perks) Signal Composer Element activation Additive inheritance Price/perk calculation Card Renderer Server-side template No client-side risk logic Cached per room, 15 min TTL Data Pipeline Layer Booking DB Room inventory Target move-in dates Pricing Engine Base rate per room Discount rules by tier PostHog Experiment analytics Session + funnel data Cron Job Daily risk recalc Pipeline sync Cache Redis / CDN 15-min TTL Feedback + Measurement Layer A/B Experiment PostHog feature flags 50/50 split, 28 days Conversion Tracking CTR, booking rate, time-to-book Per-tier, per-city, per-device Guardrails Cancellation rate, NPS Support tickets, discount depth Revenue Impact Vacancy cost reduction +34% booking conversion FEEDBACK LOOP Risk per room . Signals per tier . Rendered per card . Measured per interaction . Iterated per cycle
03 Framework

Risk-calibrated card system

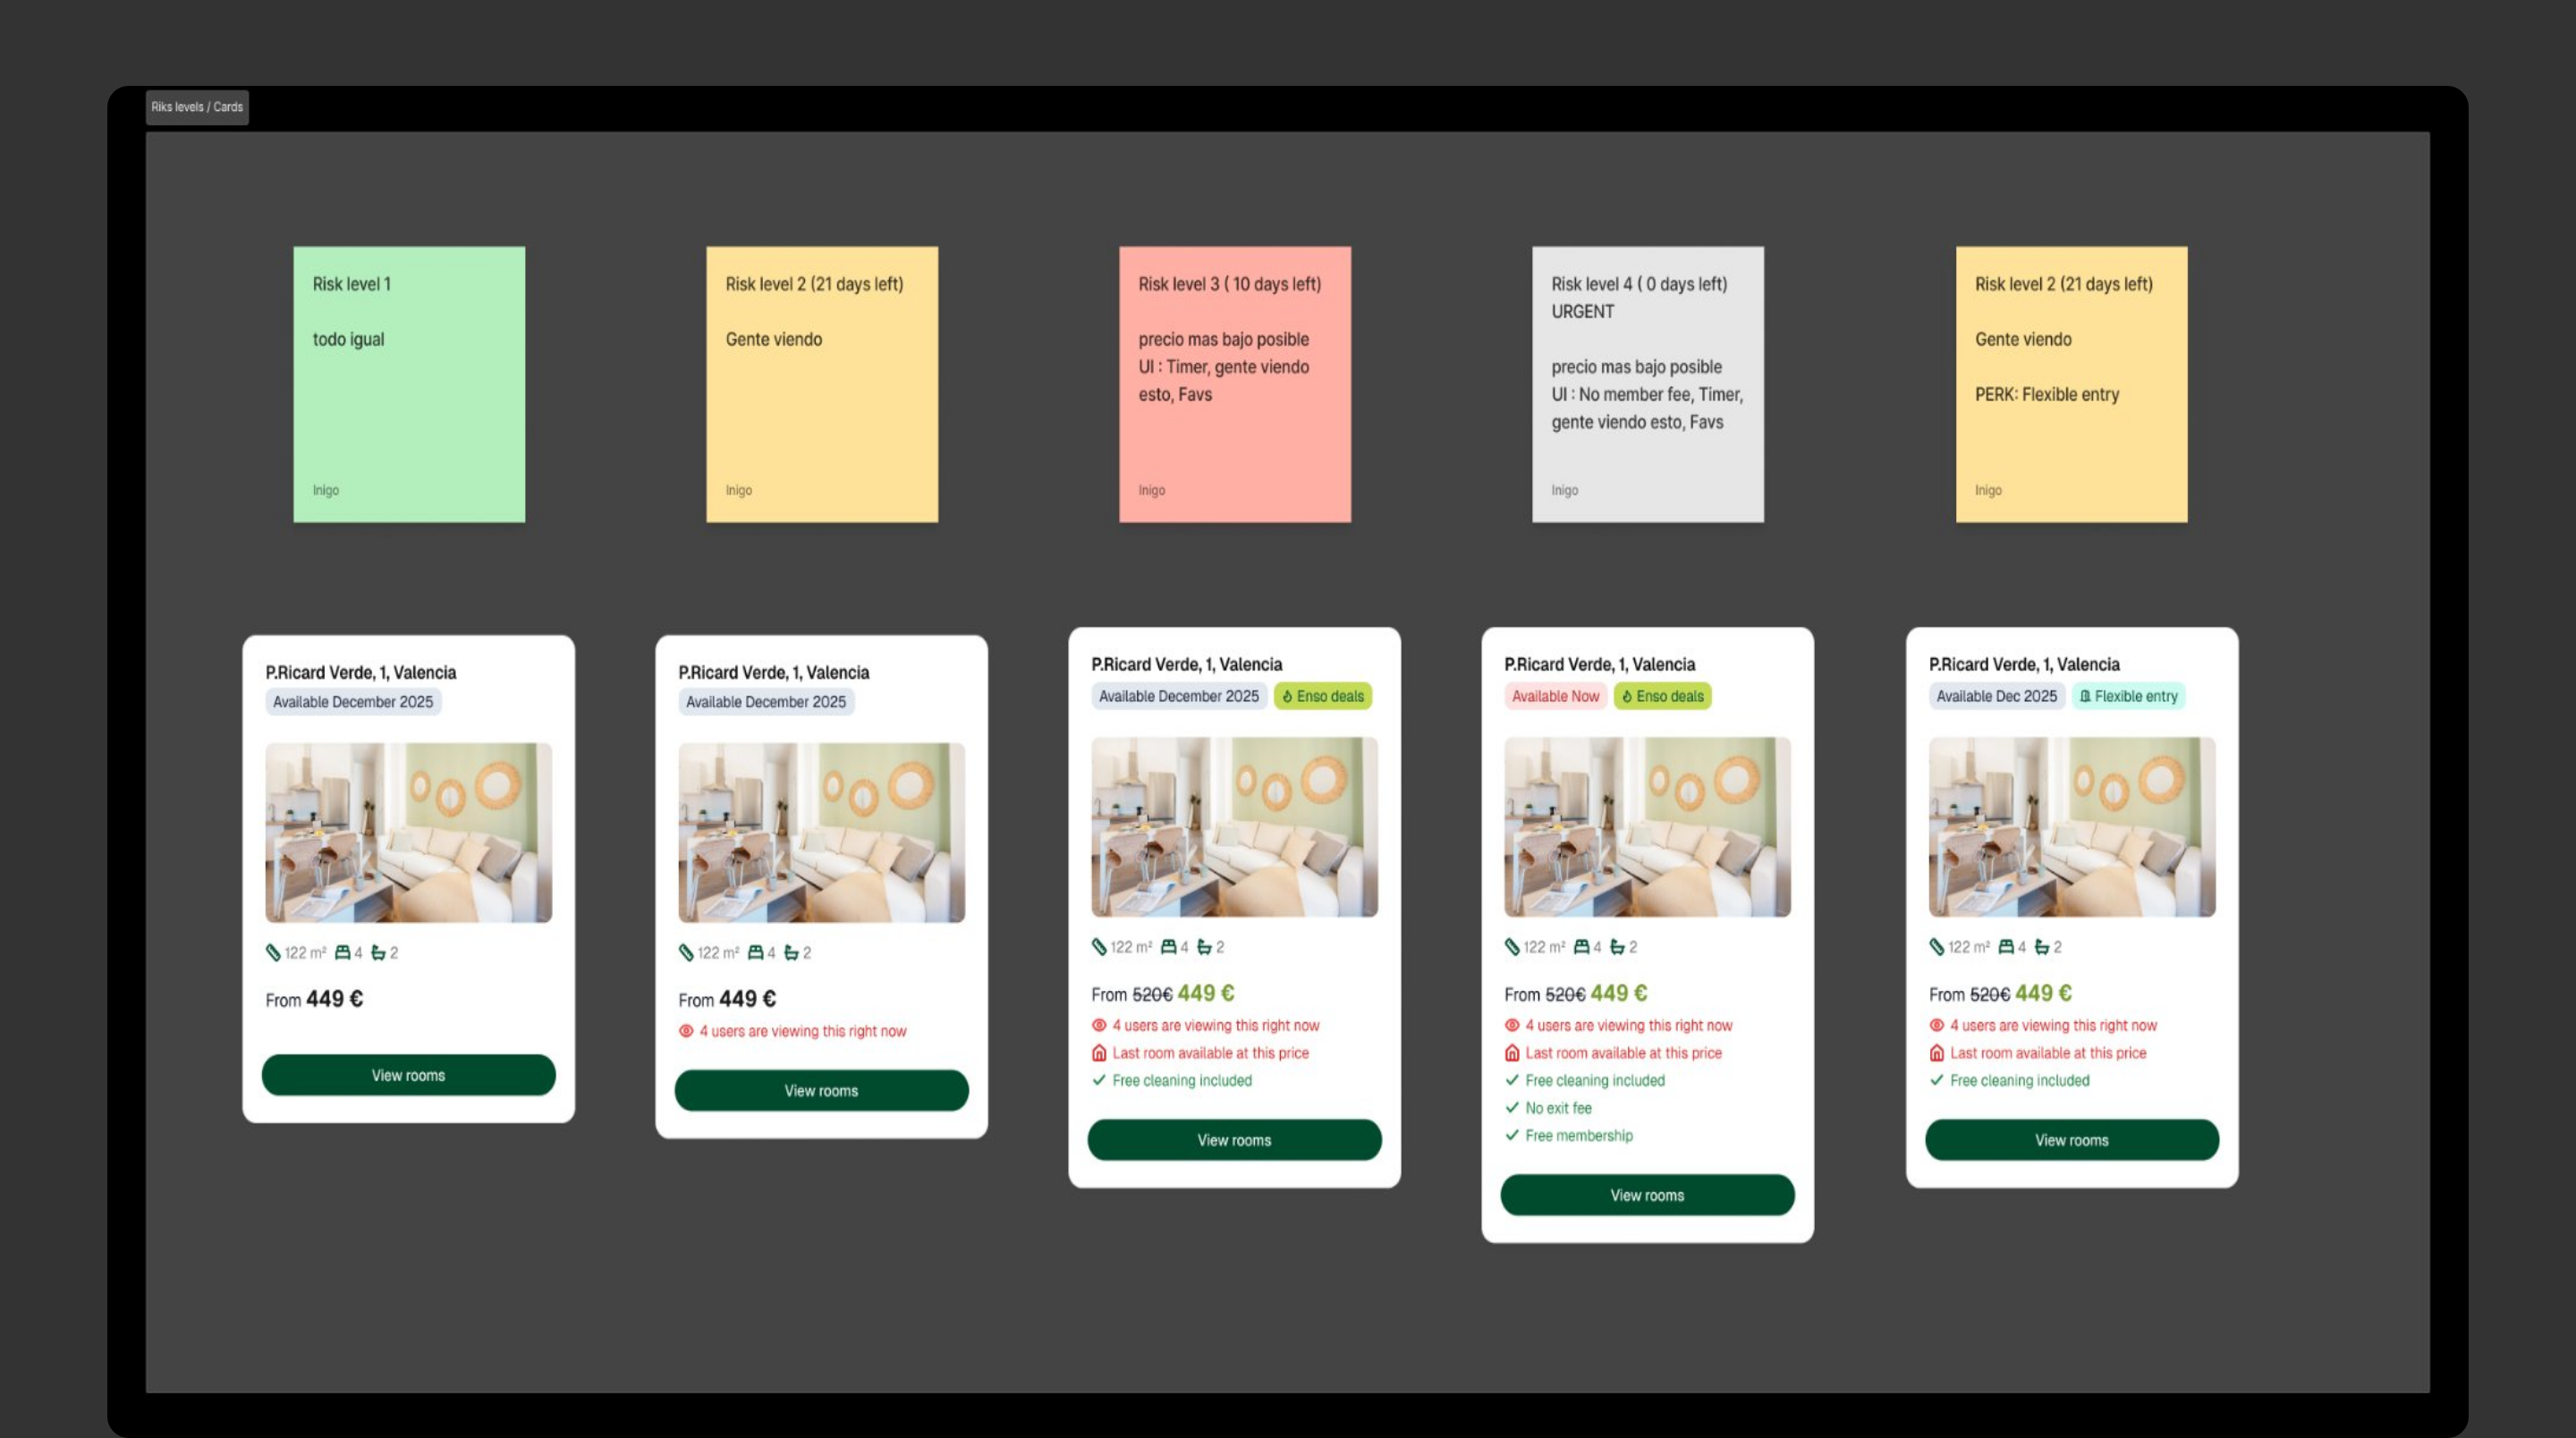
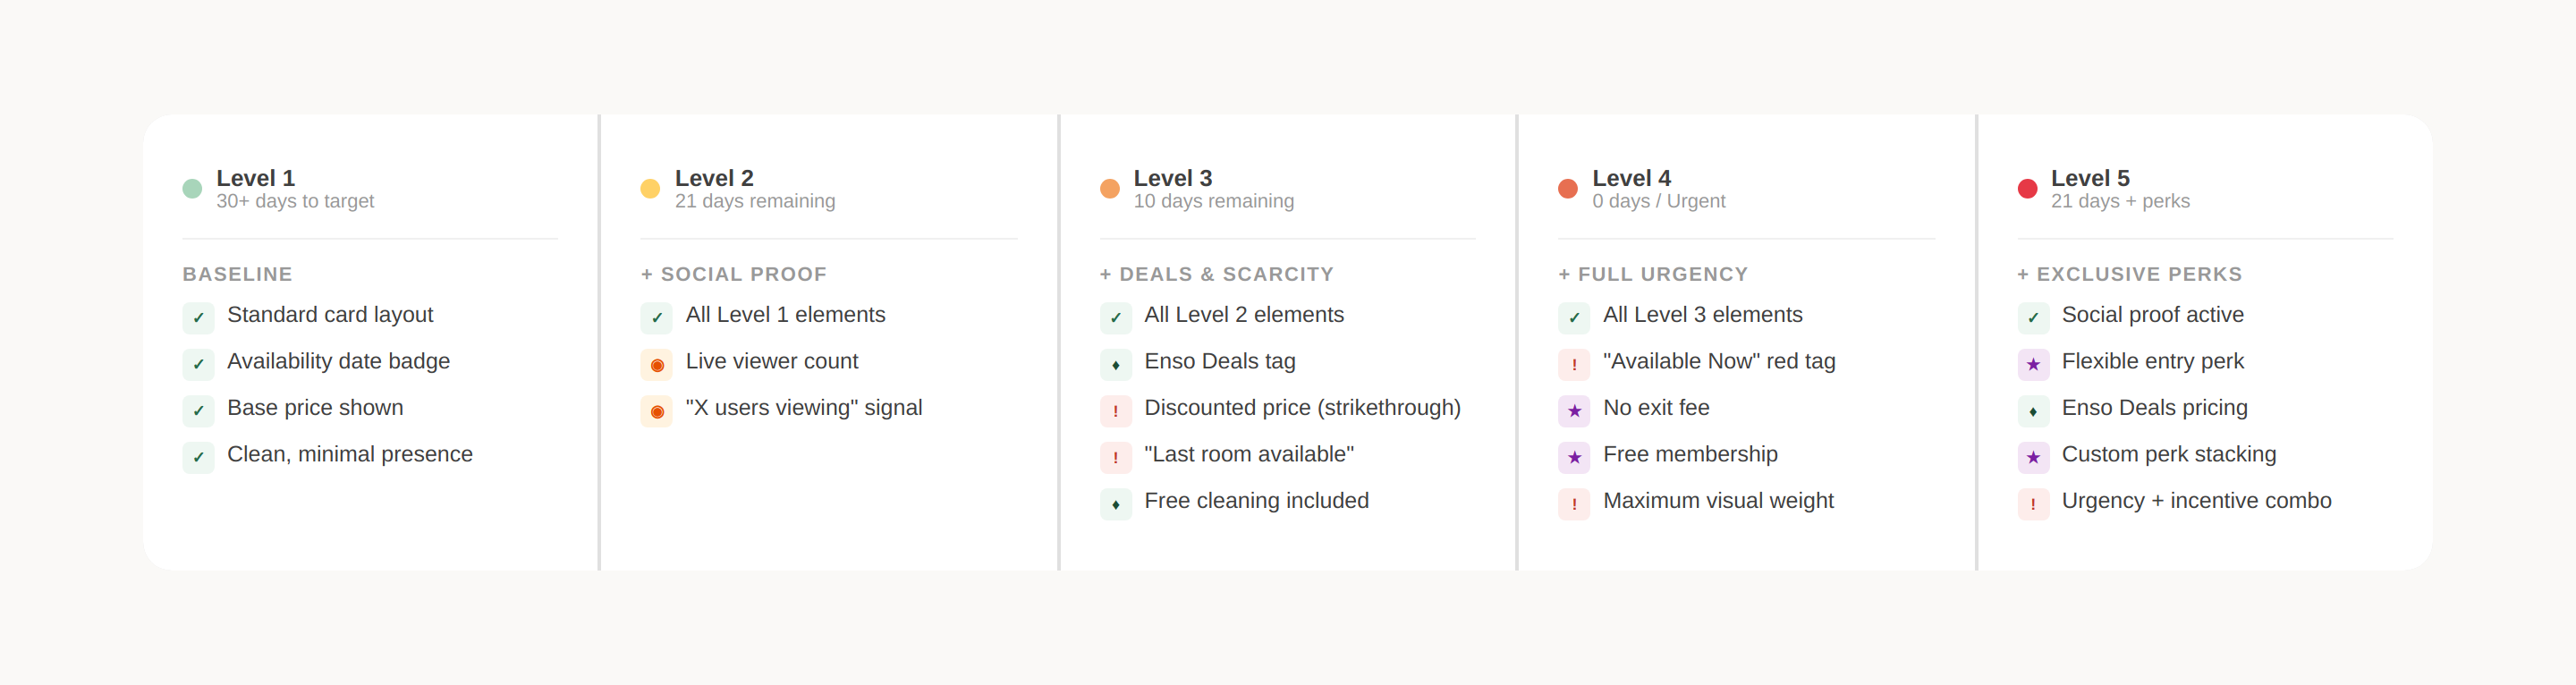
Five risk tiers drive the progressive addition of urgency elements. Each tier maps to days remaining before a room's vacancy becomes a financial liability.
Risk tiers
04 Signal Logic

Element activation matrix

Each UI element activates at a specific risk tier. Levels 1 to 4 are additive: each inherits the elements of the level below plus new ones. Level 5 does not add pressure: it swaps the heaviest perks for a flexible entry date.

UI ElementL1L2L3L4L5
Availability date tag✓✓✓✓✓
Viewer count-✓✓✓✓
Enso Deals tag--✓✓✓
Strikethrough pricing--✓✓✓
"Last room available"--✓✓-
Free cleaning--✓✓✓
No exit fee---✓-
Free membership---✓-
Flexible entry perk----✓
05 Card Evolution

Progressive urgency in action

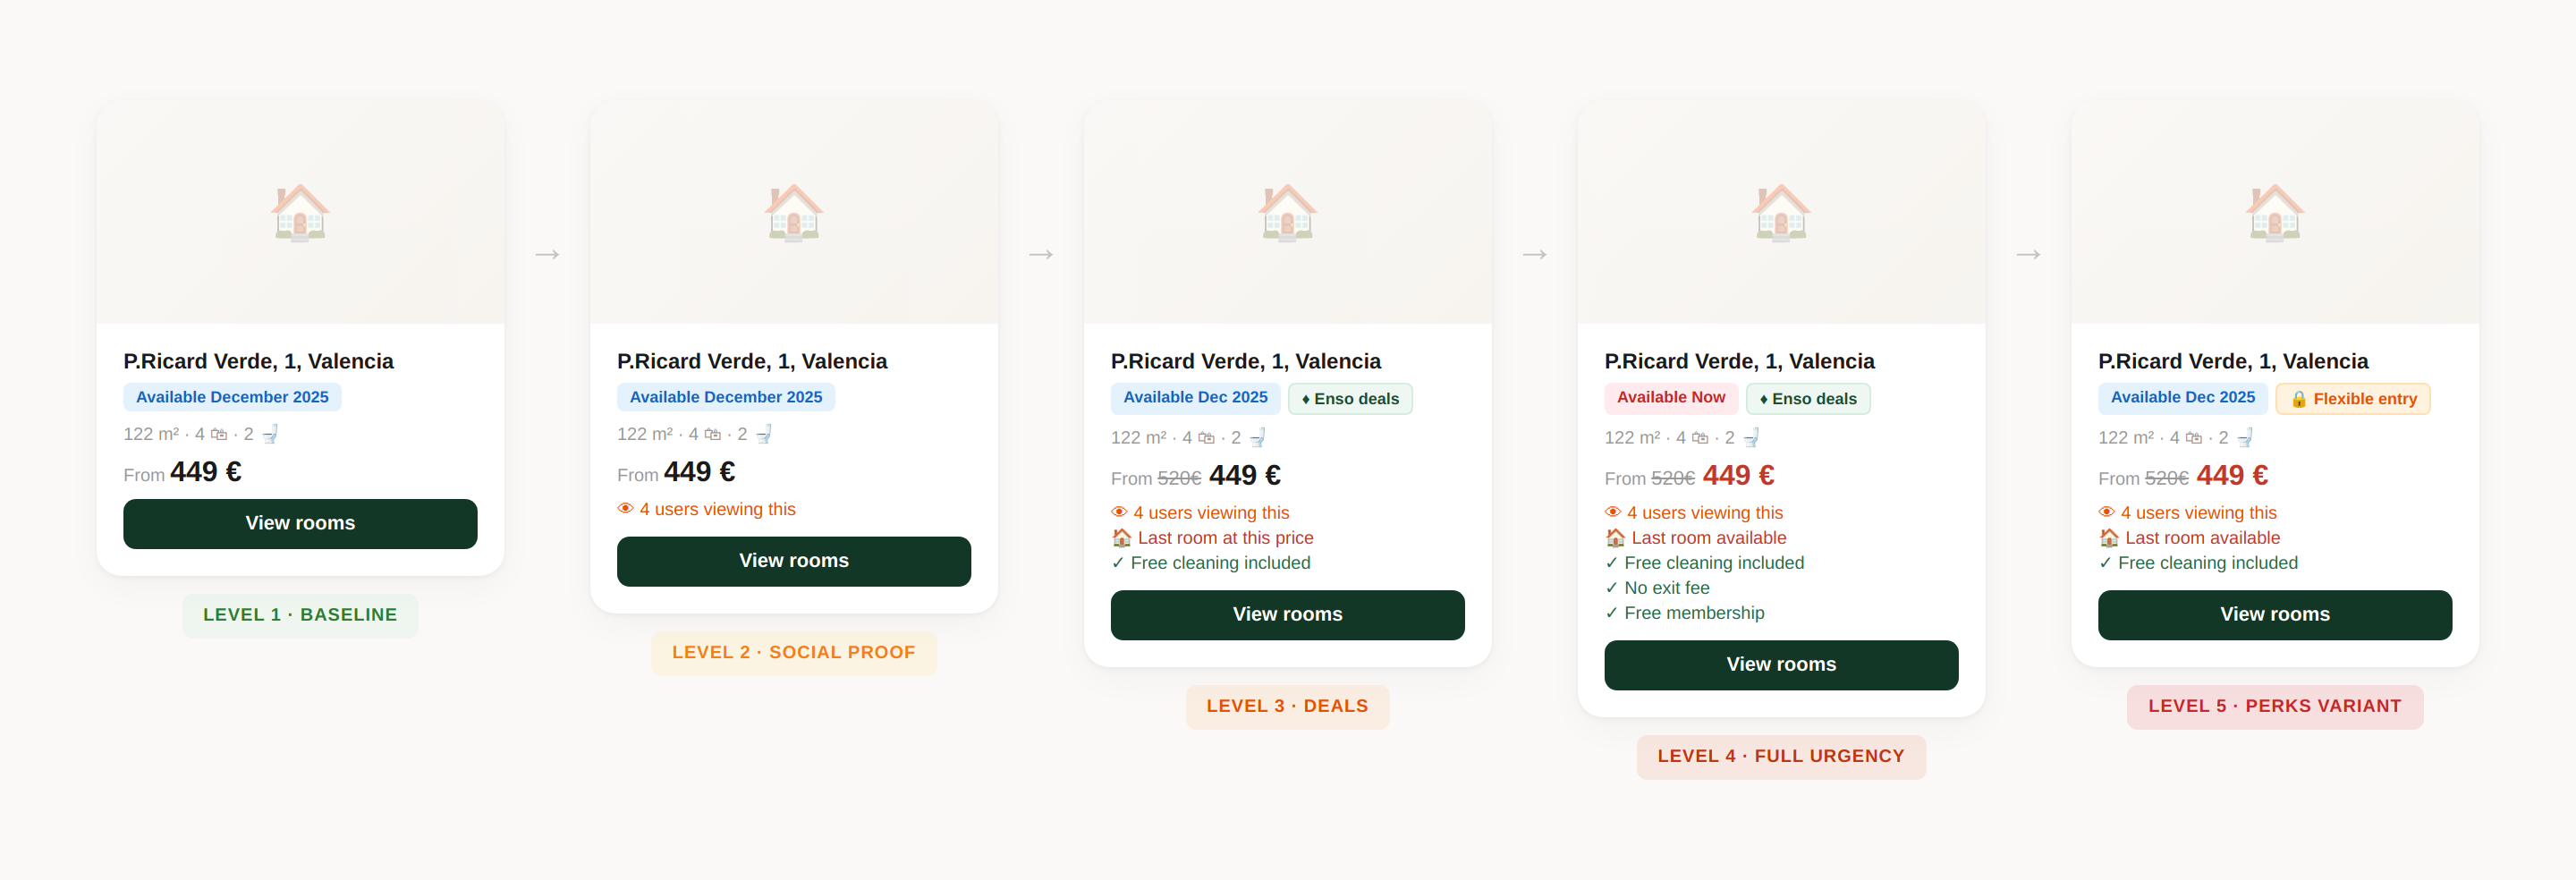
The same habi card at each risk tier. Visual density and conversion pressure increase only when warranted by actual vacancy risk.
Card variants
Card anatomy
Risk levels
06 User Journey

The booking decision flow

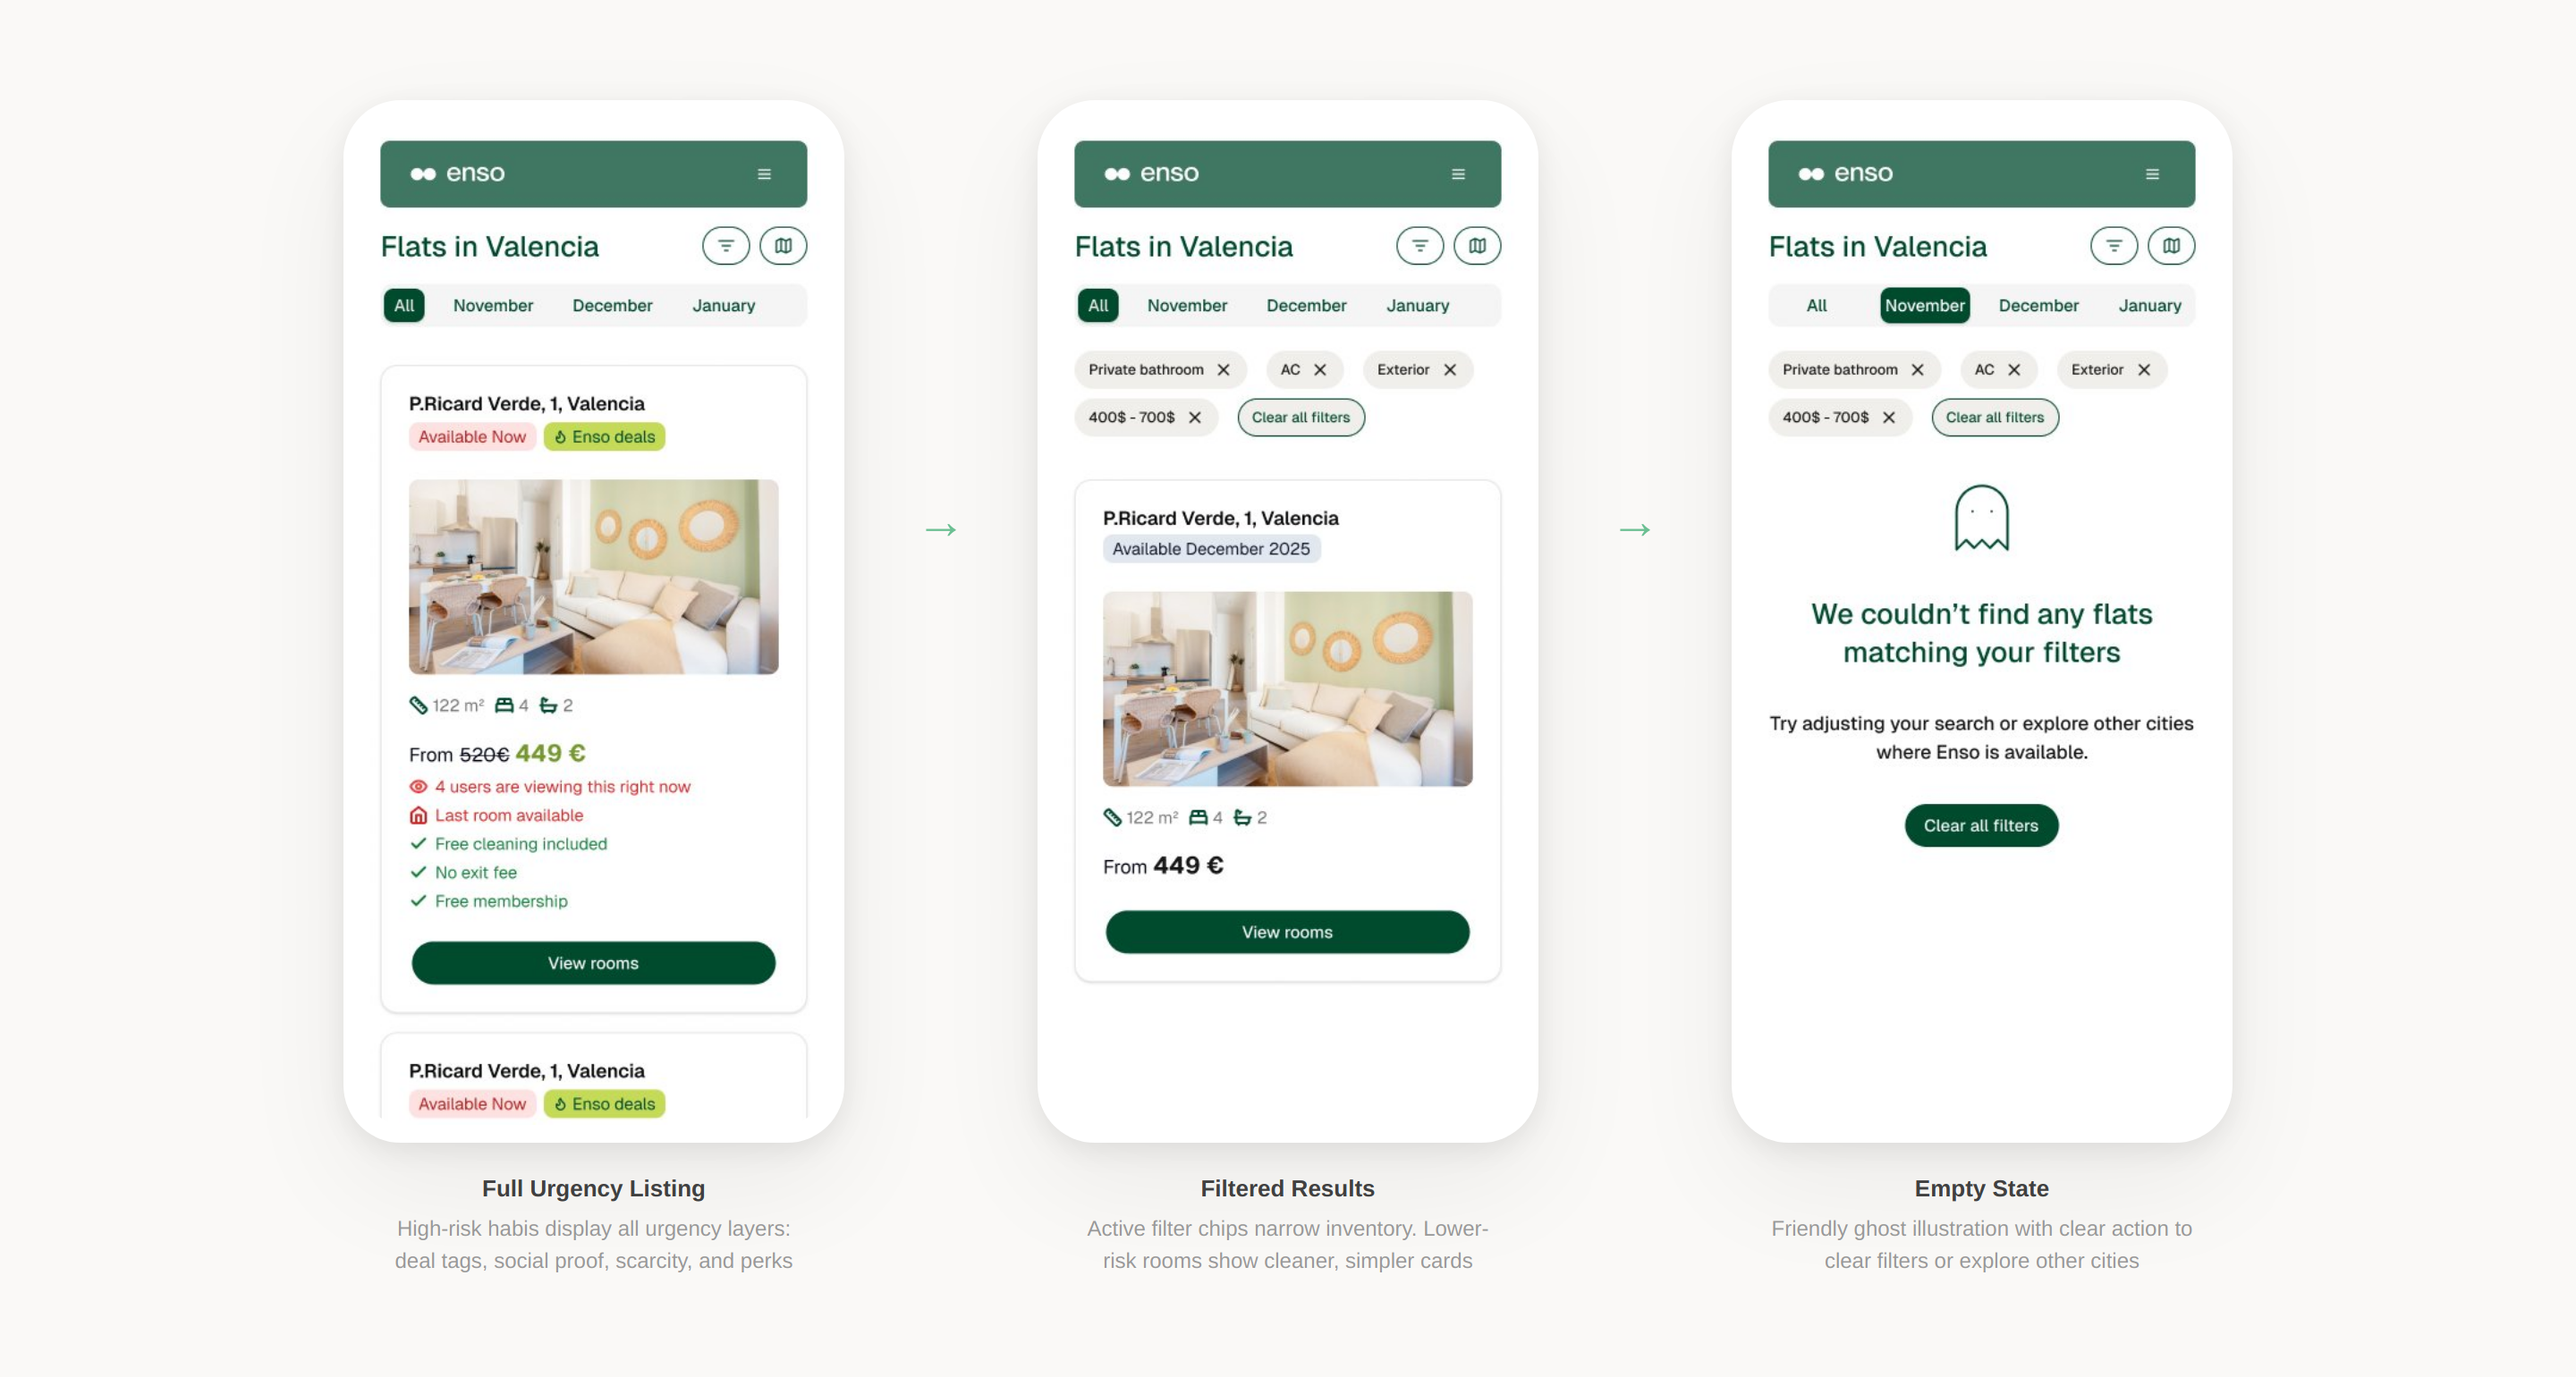
From city landing to checkout, urgency signals compound across the funnel.
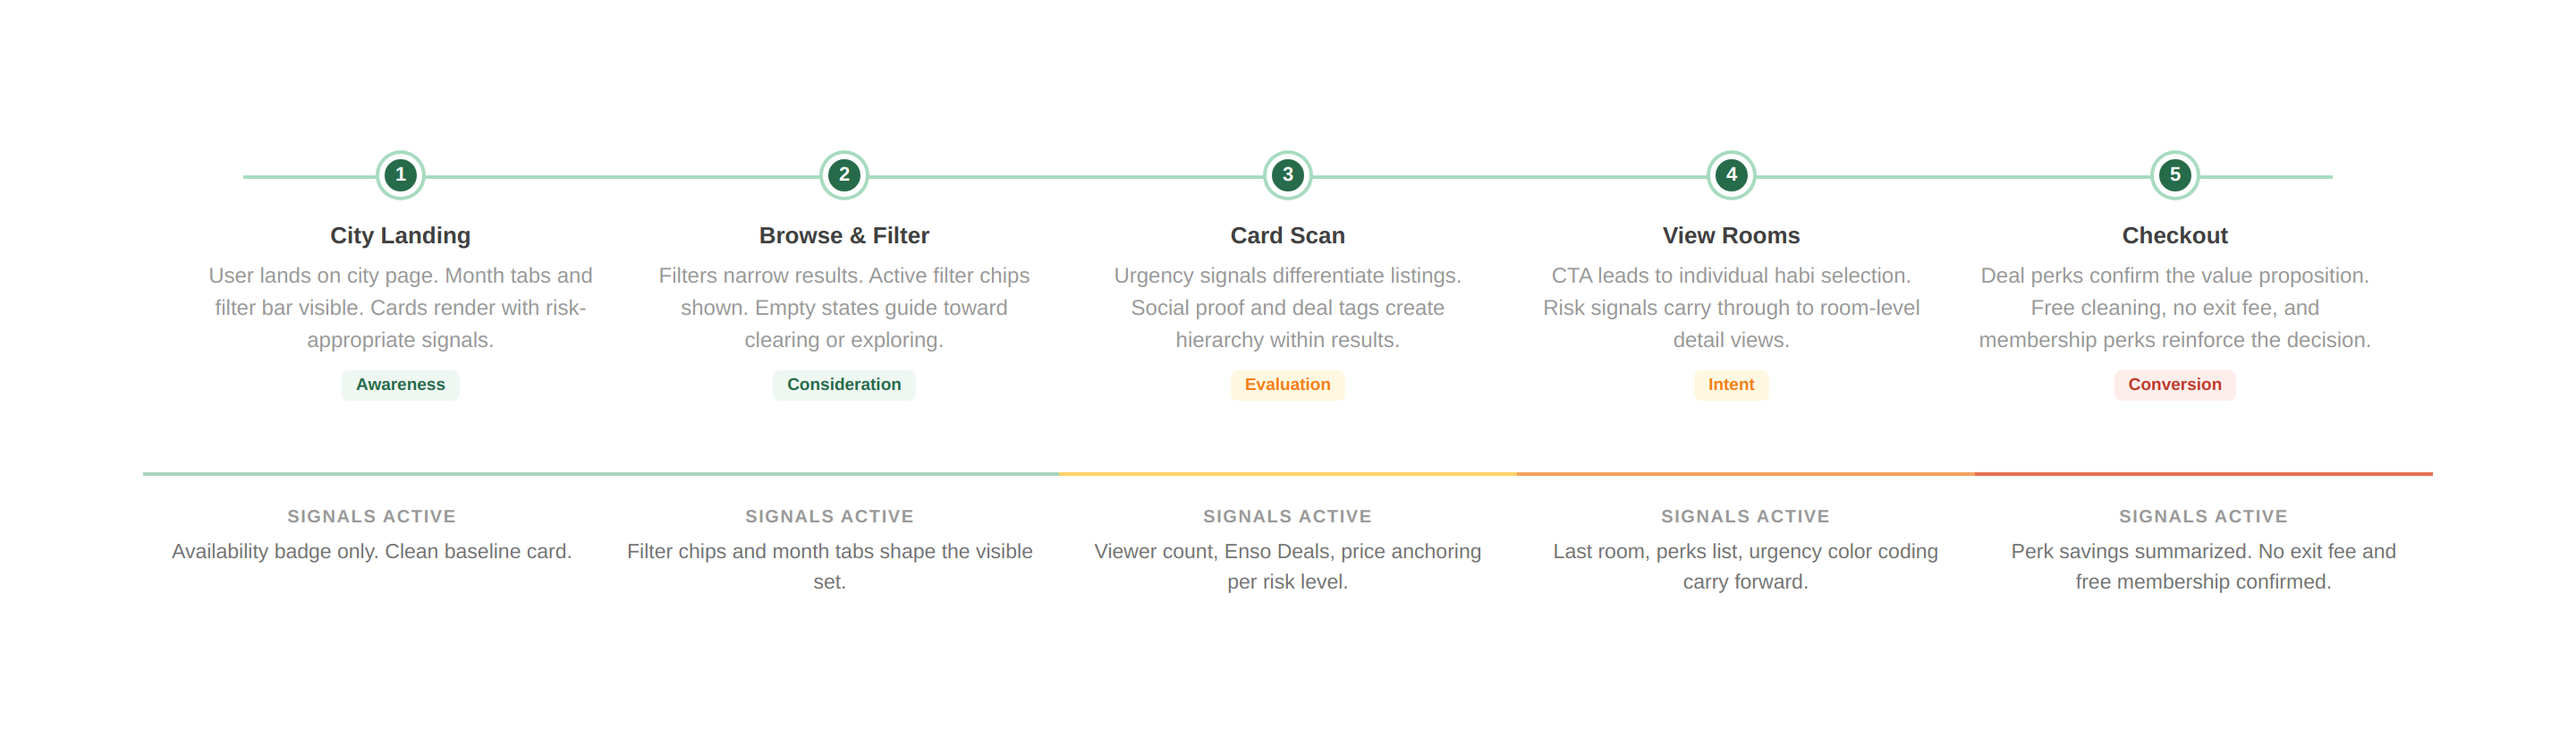
Booking flow
Mobile screens
07 Validation

A/B experiment: Dynamic Urgency Signals v1

PostHog controlled experiment. 14,208 unique users, 50/50 split, 28-day duration. Variant A (risk-based cards) vs Control (static cards).
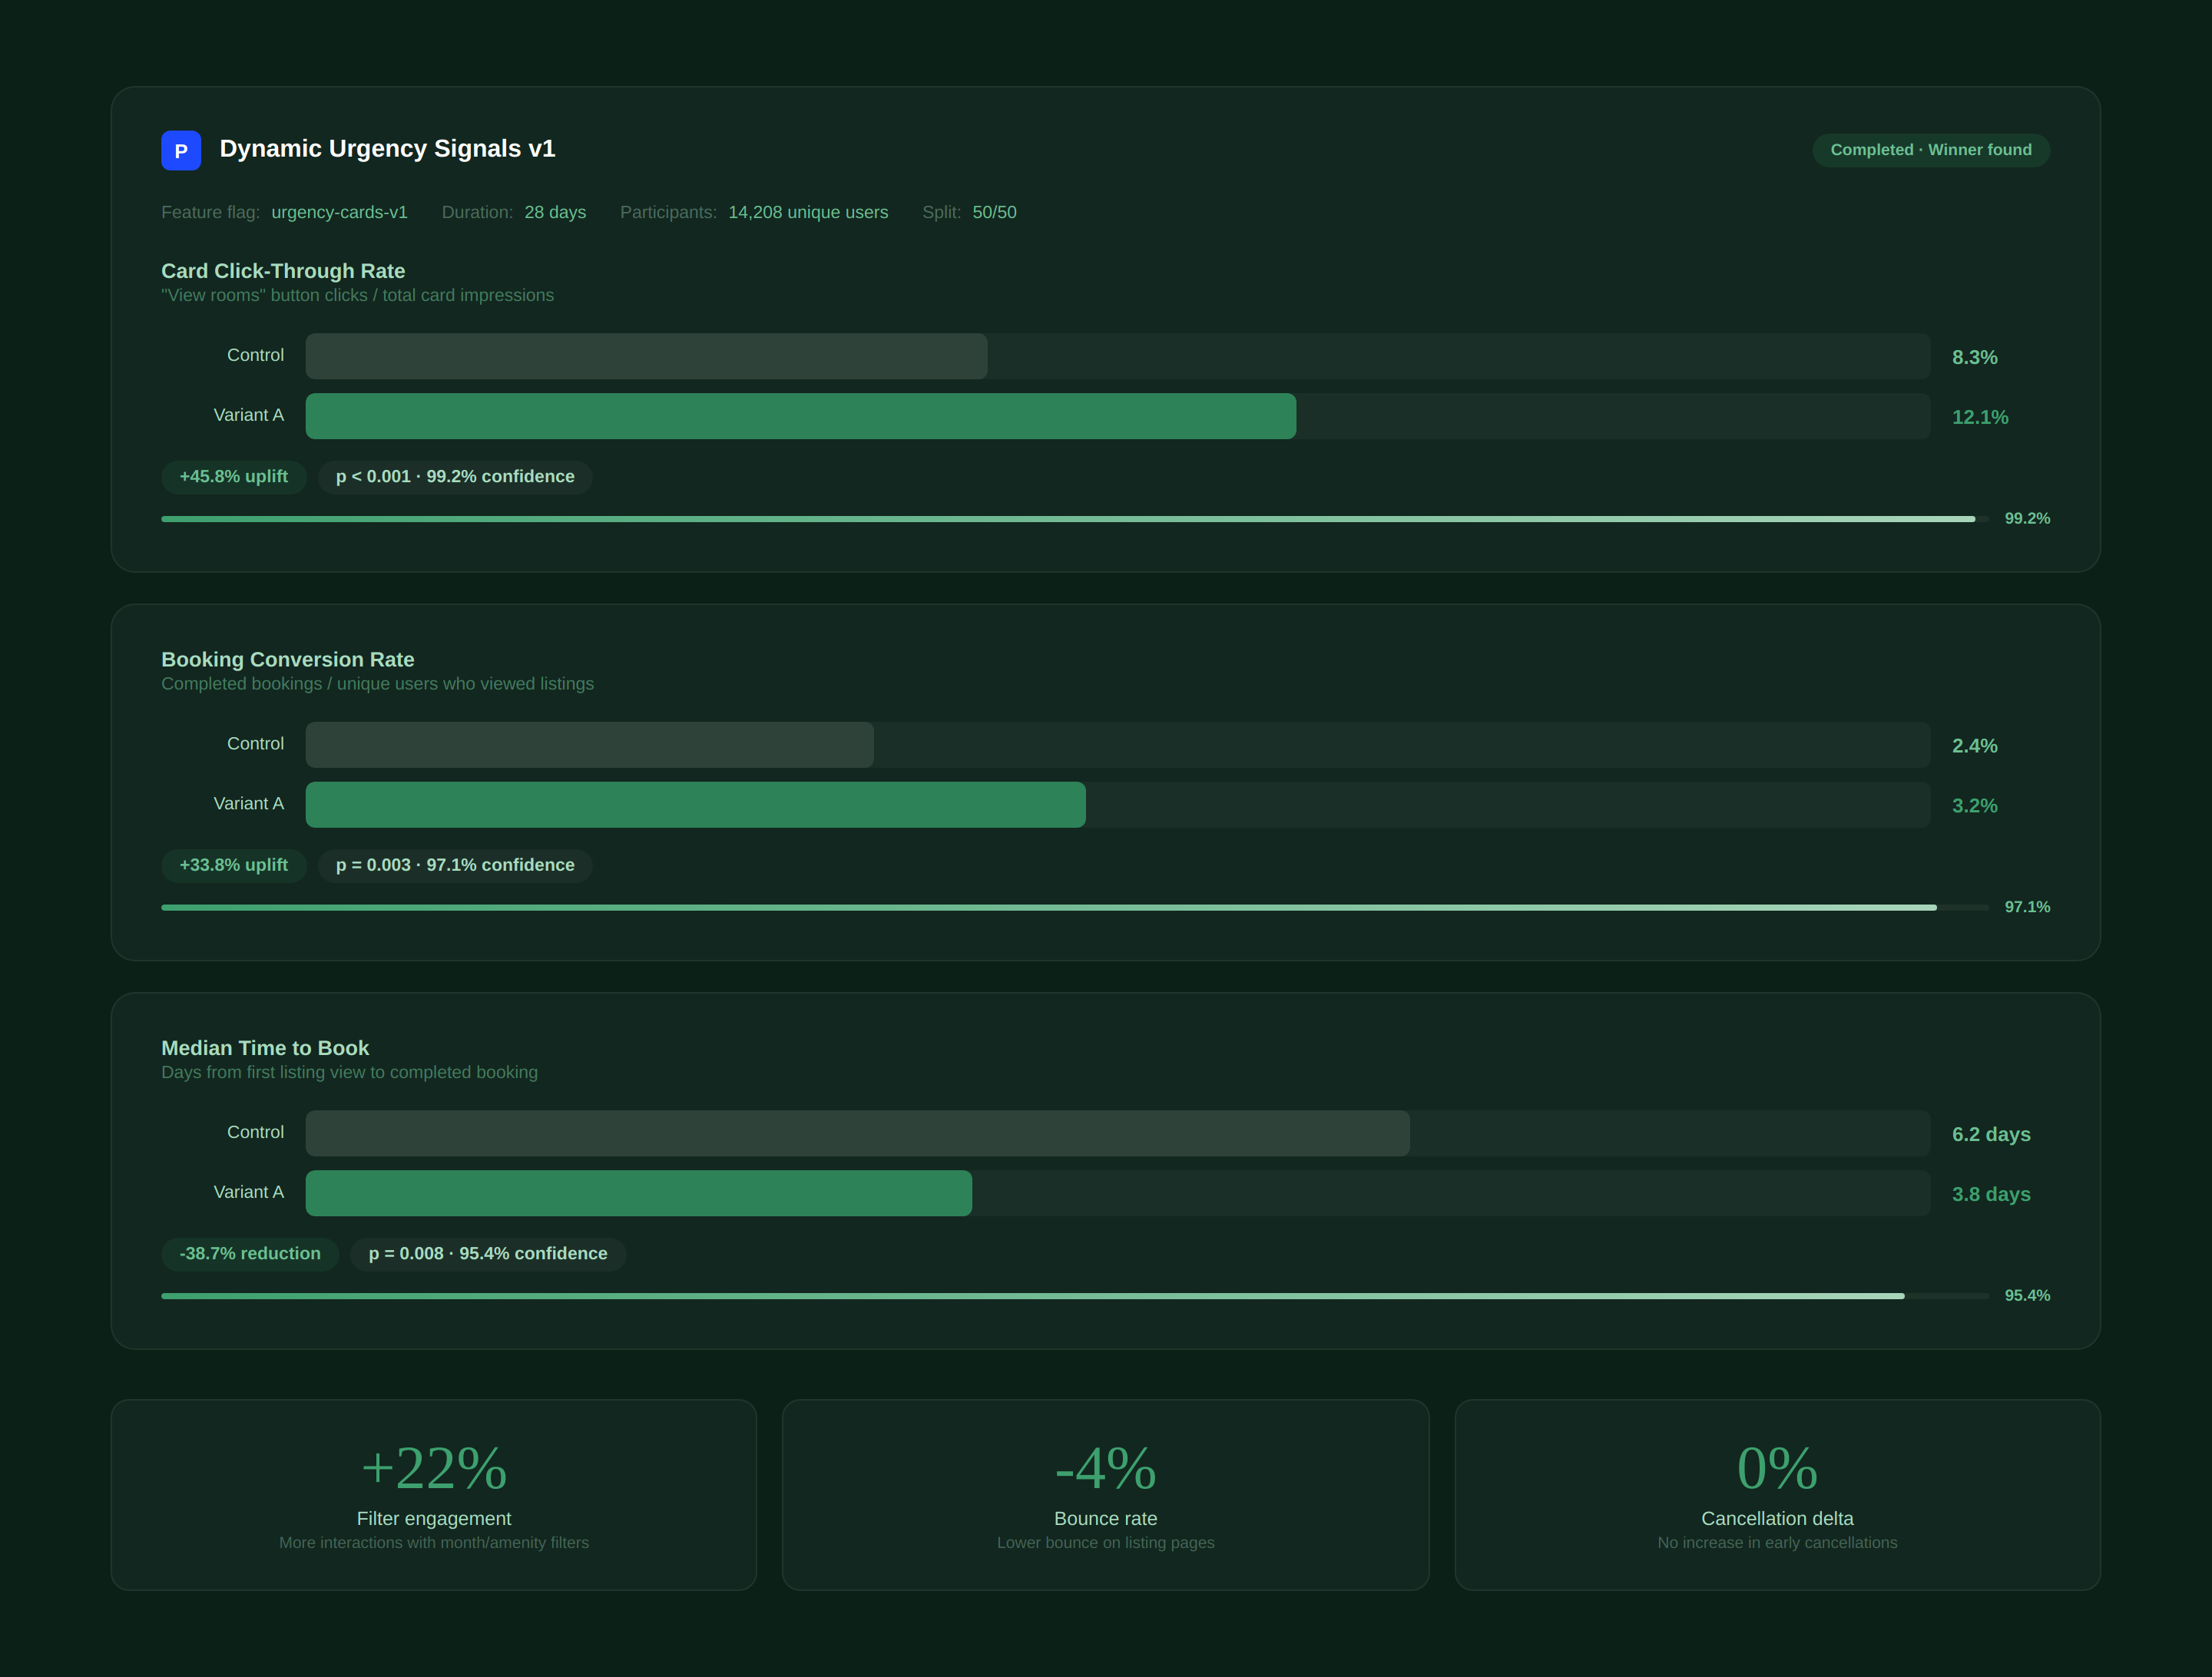
Card Click-Through Rate +45.8% uplift
Control
8.3%
8.3%
Variant
12.1%
12.1%
p < 0.001 "View rooms" clicks / total card impressions
Booking Conversion Rate +33.8% uplift
Control
2.4%
2.4%
Variant
3.2%
3.2%
p = 0.003 Completed bookings / unique listing viewers
Median Time to Book -38.7% faster
Control
6.2 days
6.2d
Variant
3.8 days
3.8d
p = 0.008 Days from first listing view to completed booking
Users14,208
Duration28 days
Split50/50
SignificanceDay 16
PlatformPostHog
PostHog experiment
08 Funnel Analysis

Where the uplift compounded

Card click-through was the primary lever (+45.8%), but gains compounded downstream. The urgency signals didn't just attract clicks. They attracted higher-intent clicks.

5-Step Conversion Funnel
Control Variant (risk-based cards)
Card impression
100%
100%
baseline
↓
Card click
8.3%
12.1%
+45.8%
↓
Room view
6.1%
8.4%
+37.7%
↓
Checkout start
3.8%
5.1%
+34.2%
↓
Booking
2.4%
3.2%
+33.8%
Key insight: The uplift didn't just happen at card level. It compounded through every step. Room view rate +37.7%, checkout start +34.2%. The urgency signals pre-qualified intent. Users who clicked were more likely to book.
09 Segmentation

Breakdown by city, device, and risk level

Mobile showed the highest uplift (+50%). And Level 4 drove +86% uplift, confirming that stacking perks at high-risk tiers materially accelerates conversion.
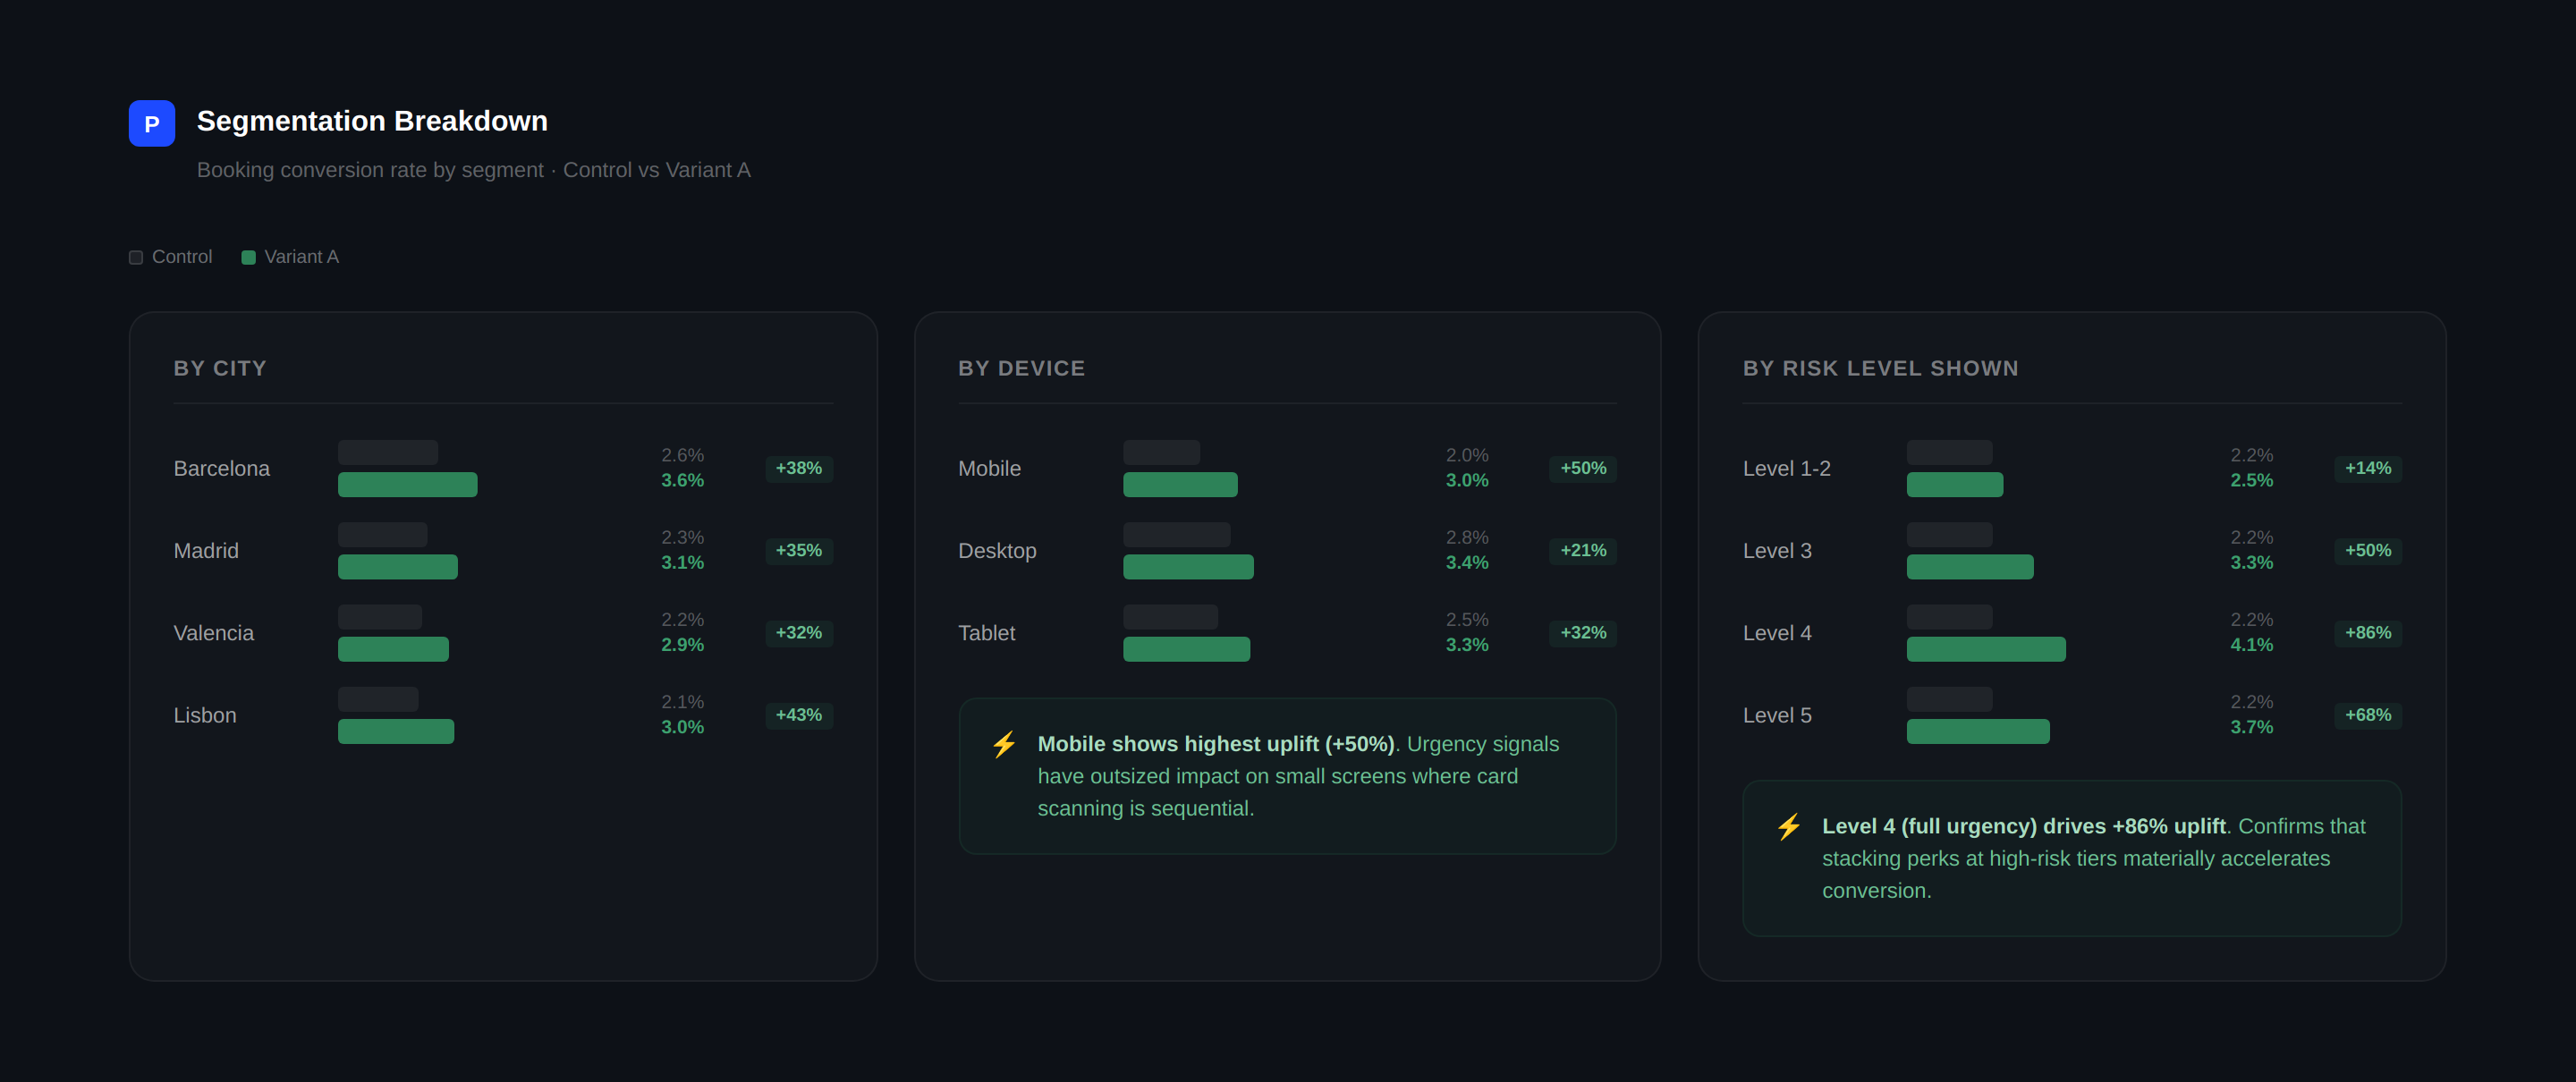
Segmentation
10 Experiment Rigor

Statistical significance over time

95% significance on Day 16. Ran full 28 days. No novelty decay. Uplift was behavioral, not curiosity-driven.
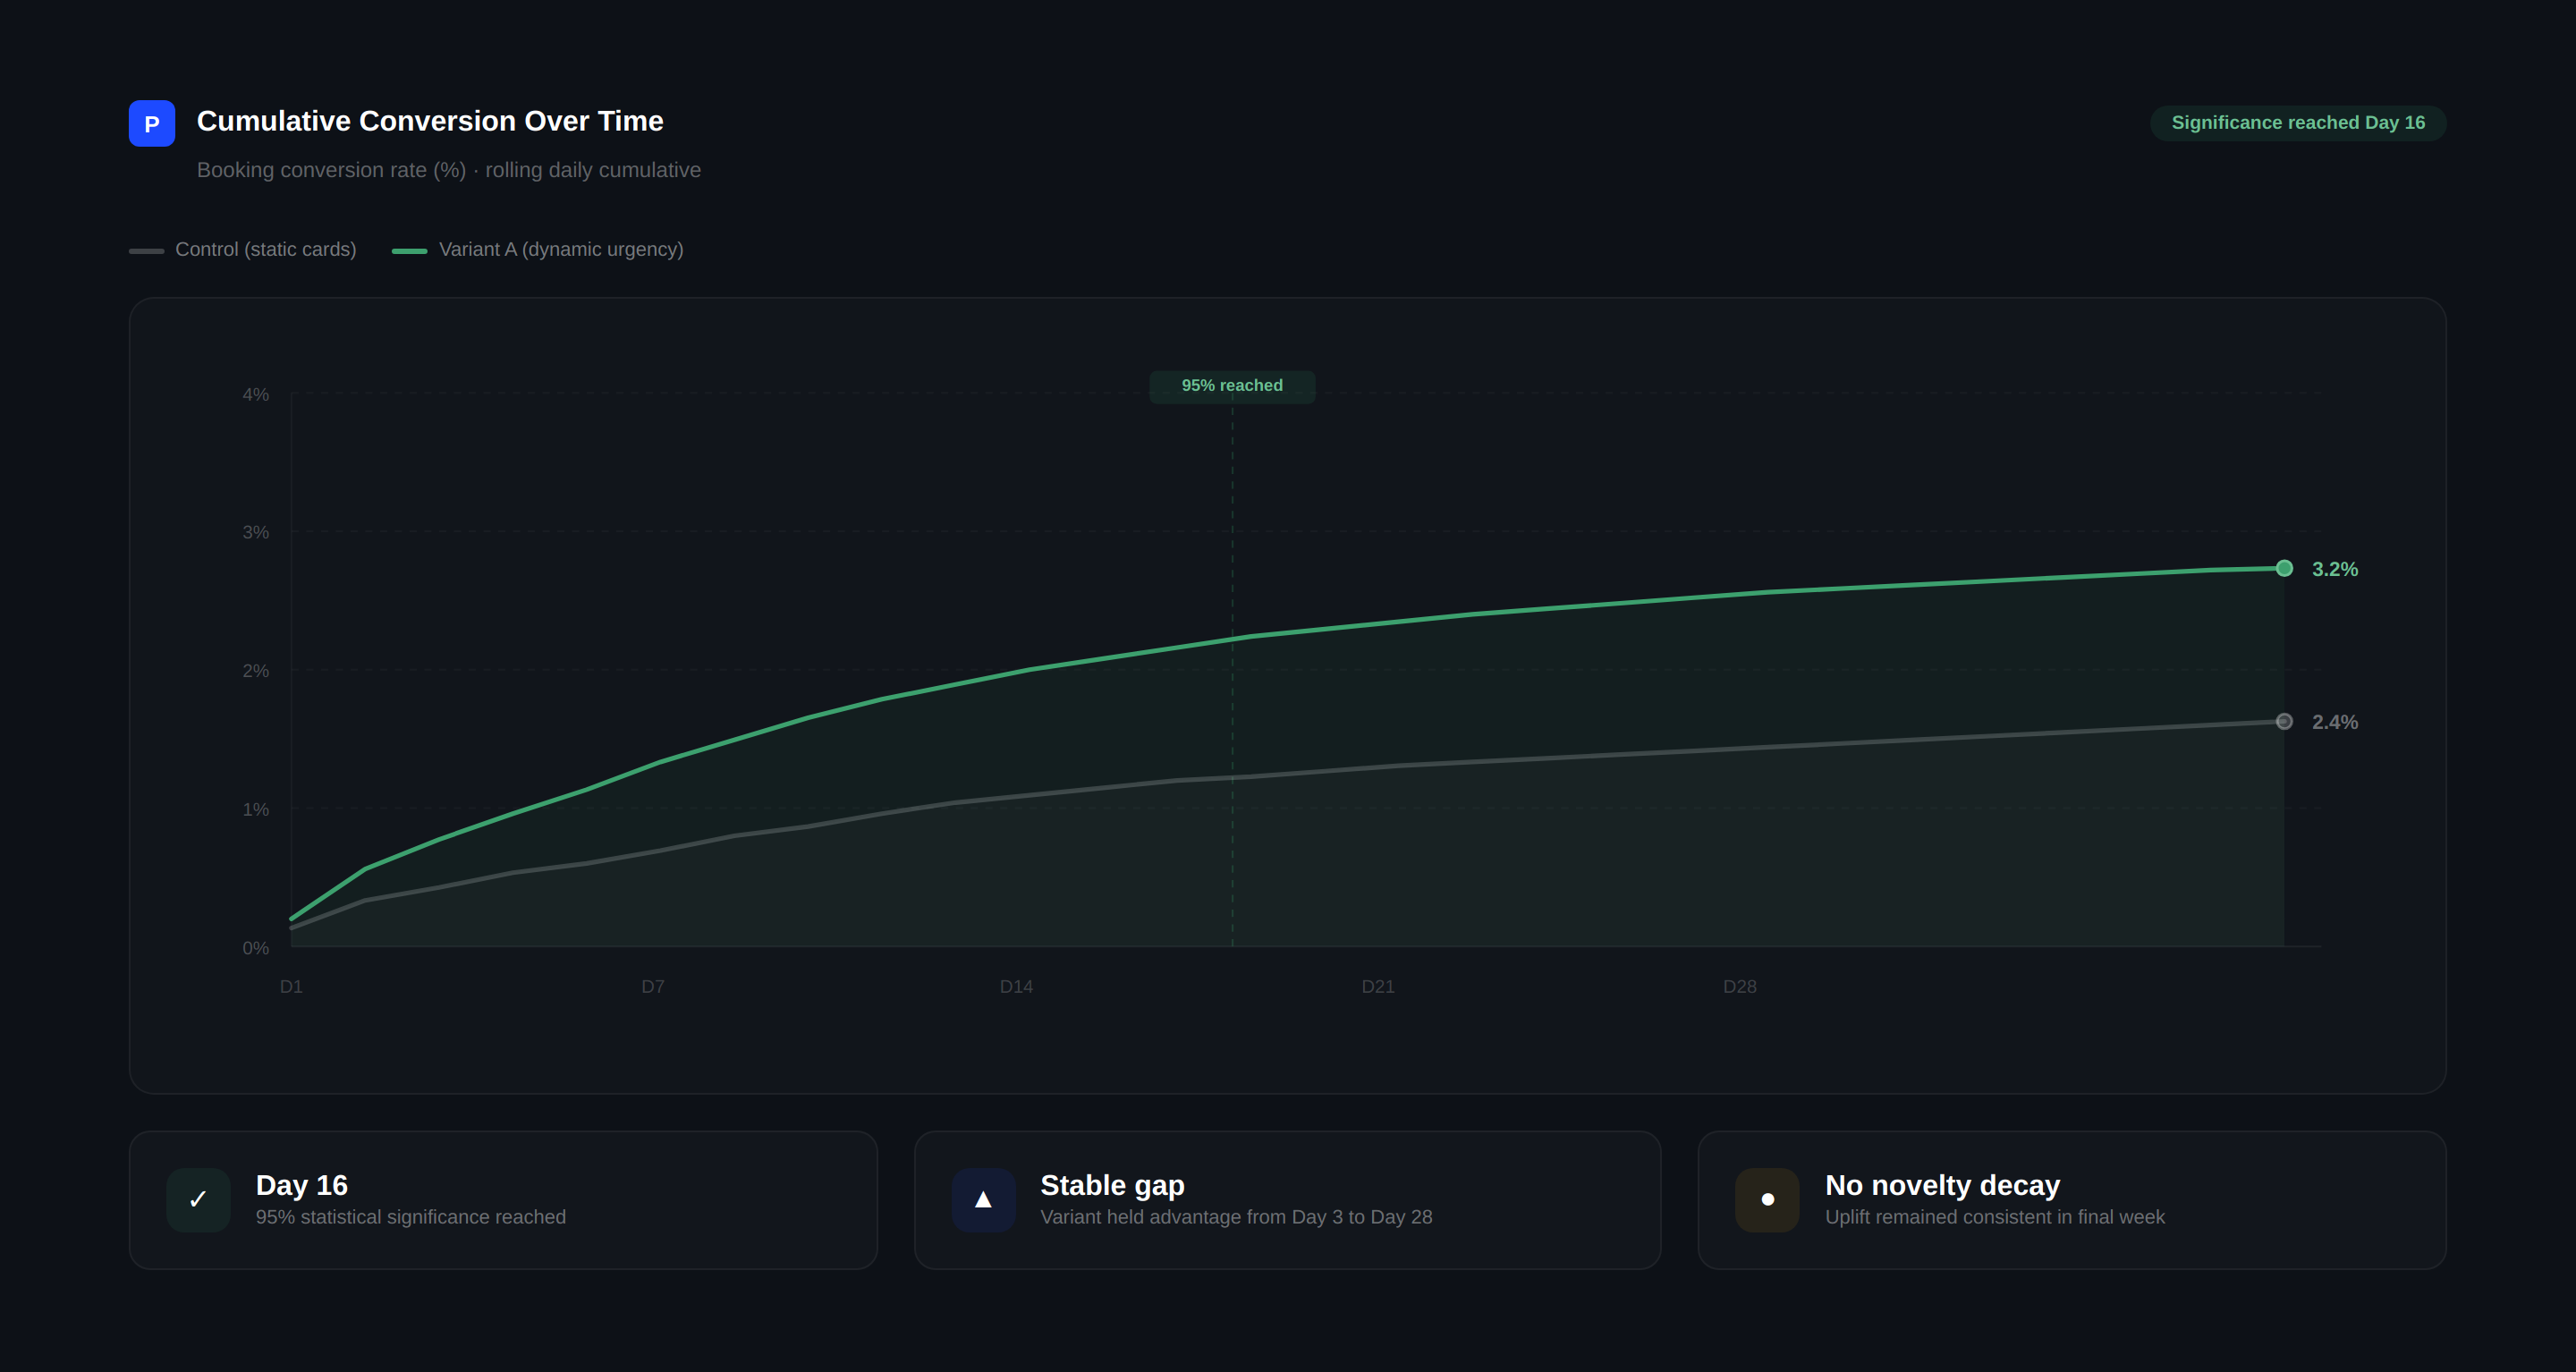
Timeline
11 Guardrails

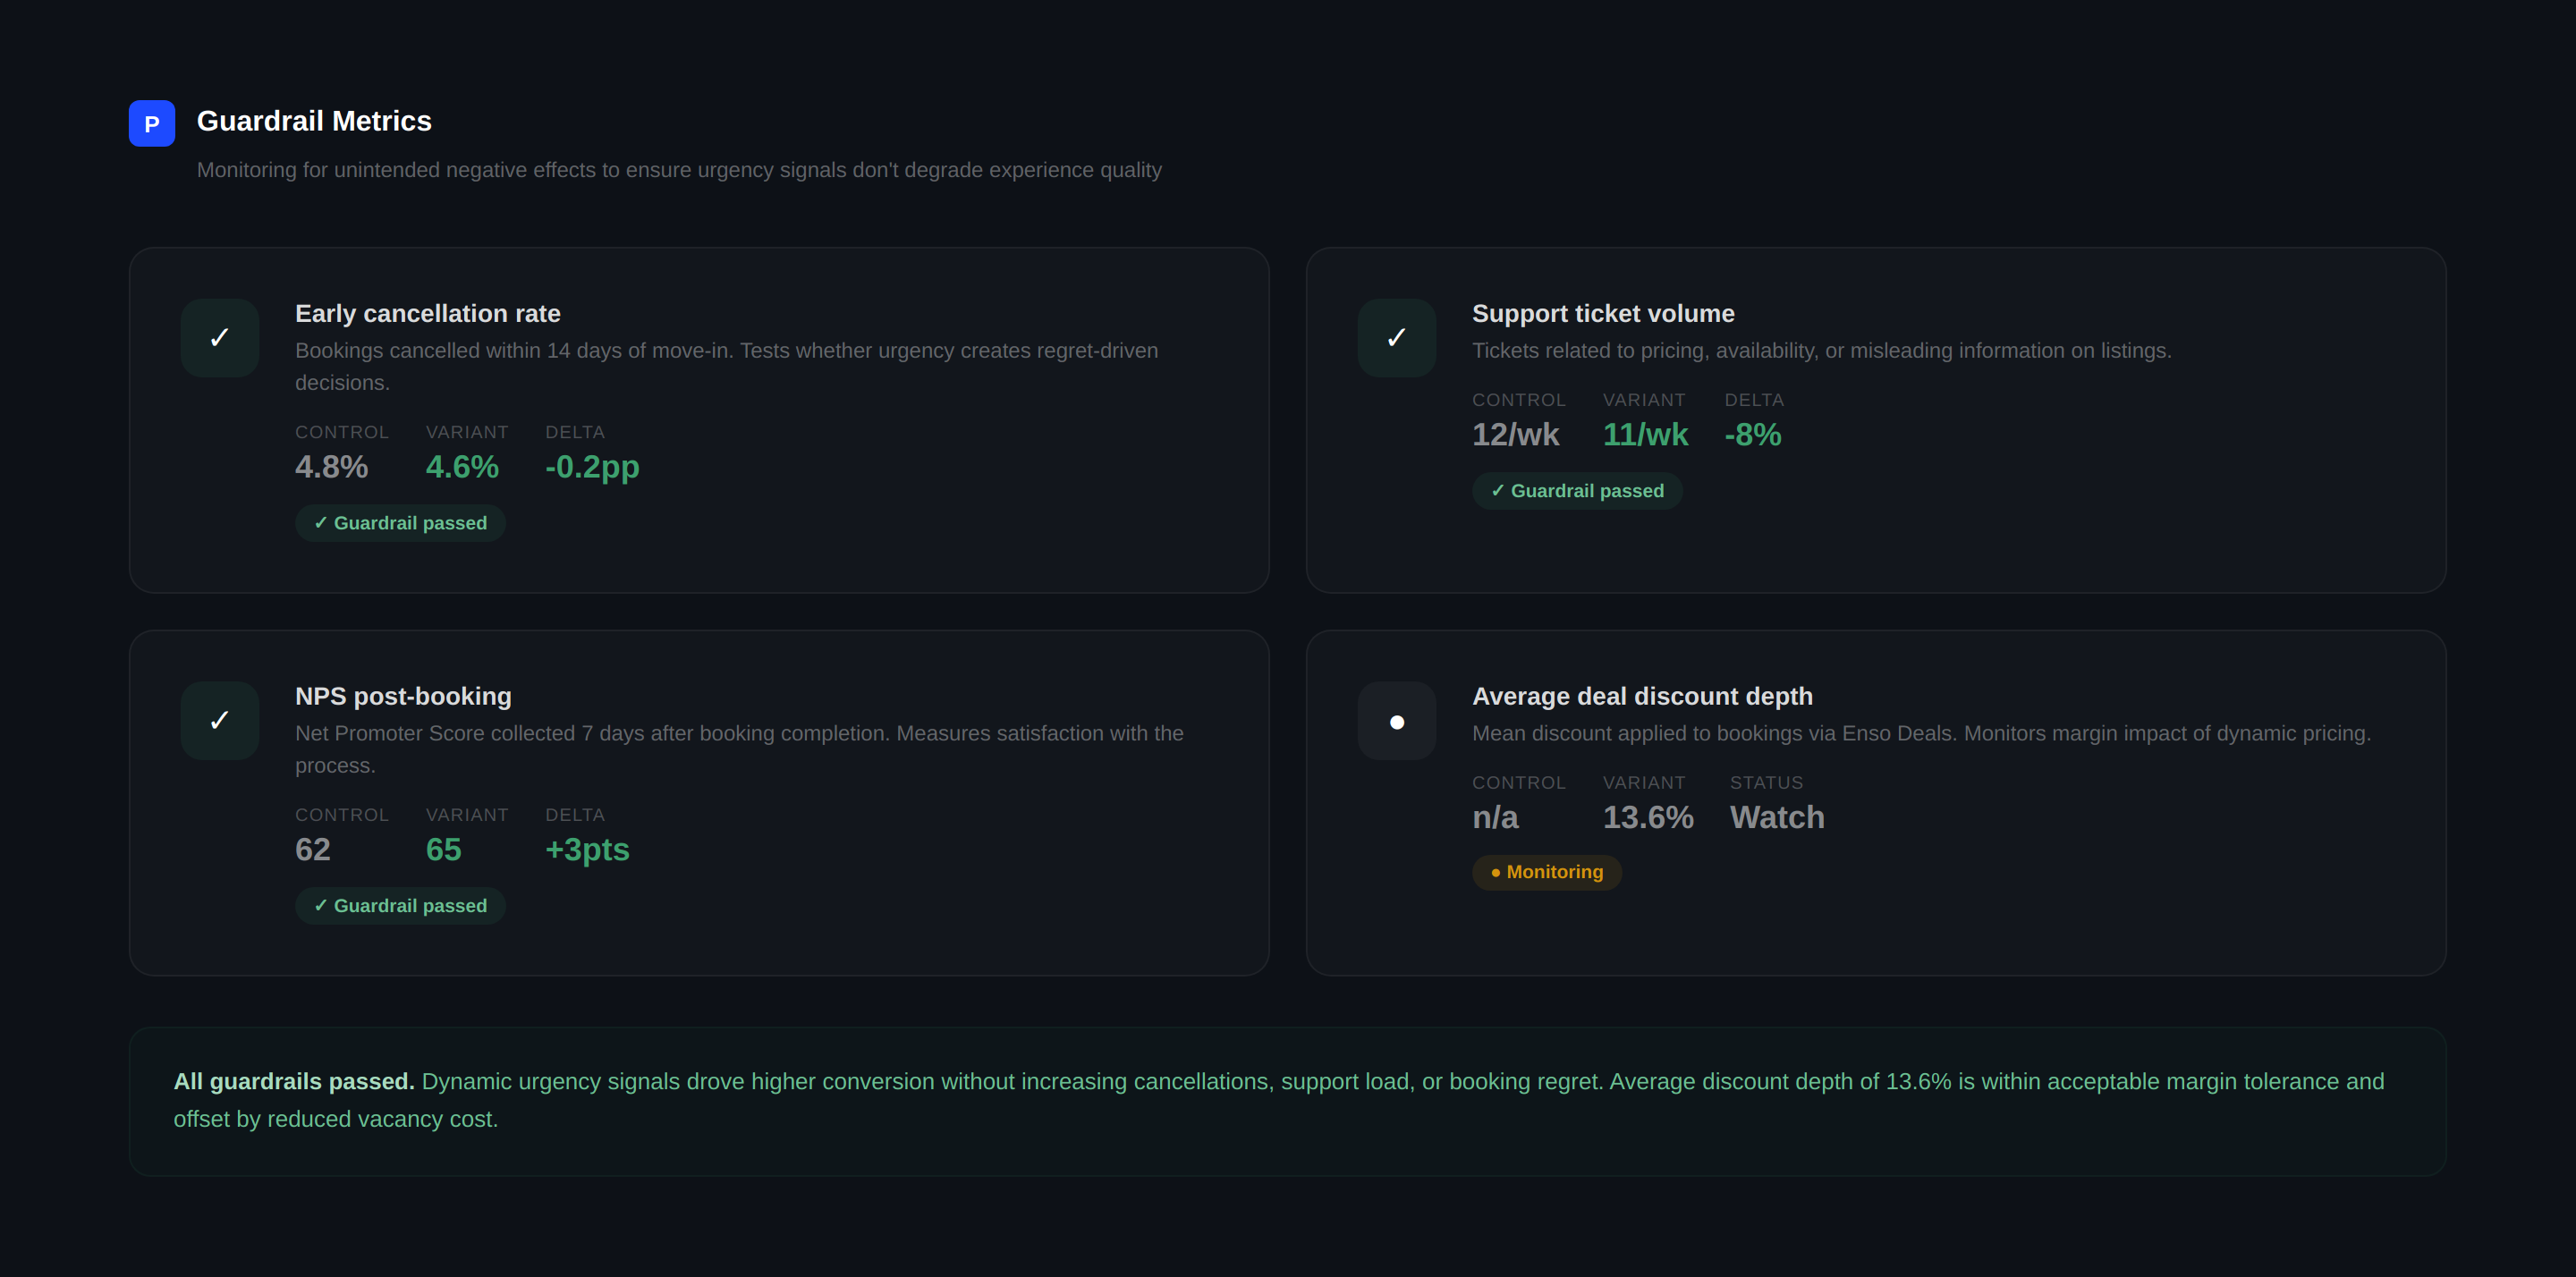
Monitoring for unintended harm

  • Early cancellation rate: Control 4.8%, Variant 4.6%. No increase.
  • Support ticket volume: Control 12/wk, Variant 11/wk. Slight decrease.
  • NPS post-booking: Control 62, Variant 65. Slight improvement.
  • Average discount depth: 13.6%. Within margin. Monitoring ongoing.
Guardrails
12 Reflection

What I learned

Why "scarcity, not pressure"Early explorations had countdown timers. 4/5 testers said "this feels like Booking.com." Trust > urgency. Always. Show what's real instead of manufacturing time pressure.
One signal I would rebuildThe test measured the whole bundle, so I cannot say how much of the lift each signal carried. The one I would rebuild first is the viewer count: today I would use signals that stay true when nobody is watching, like calendar scarcity, saves this month or a deal with a real end date.
What I'd do differentlyStart mobile-only (73% of traffic). Track cross-device journeys from Day 1. A/B test individual signals, not the full bundle.
13 Impact

Result of the A/B test

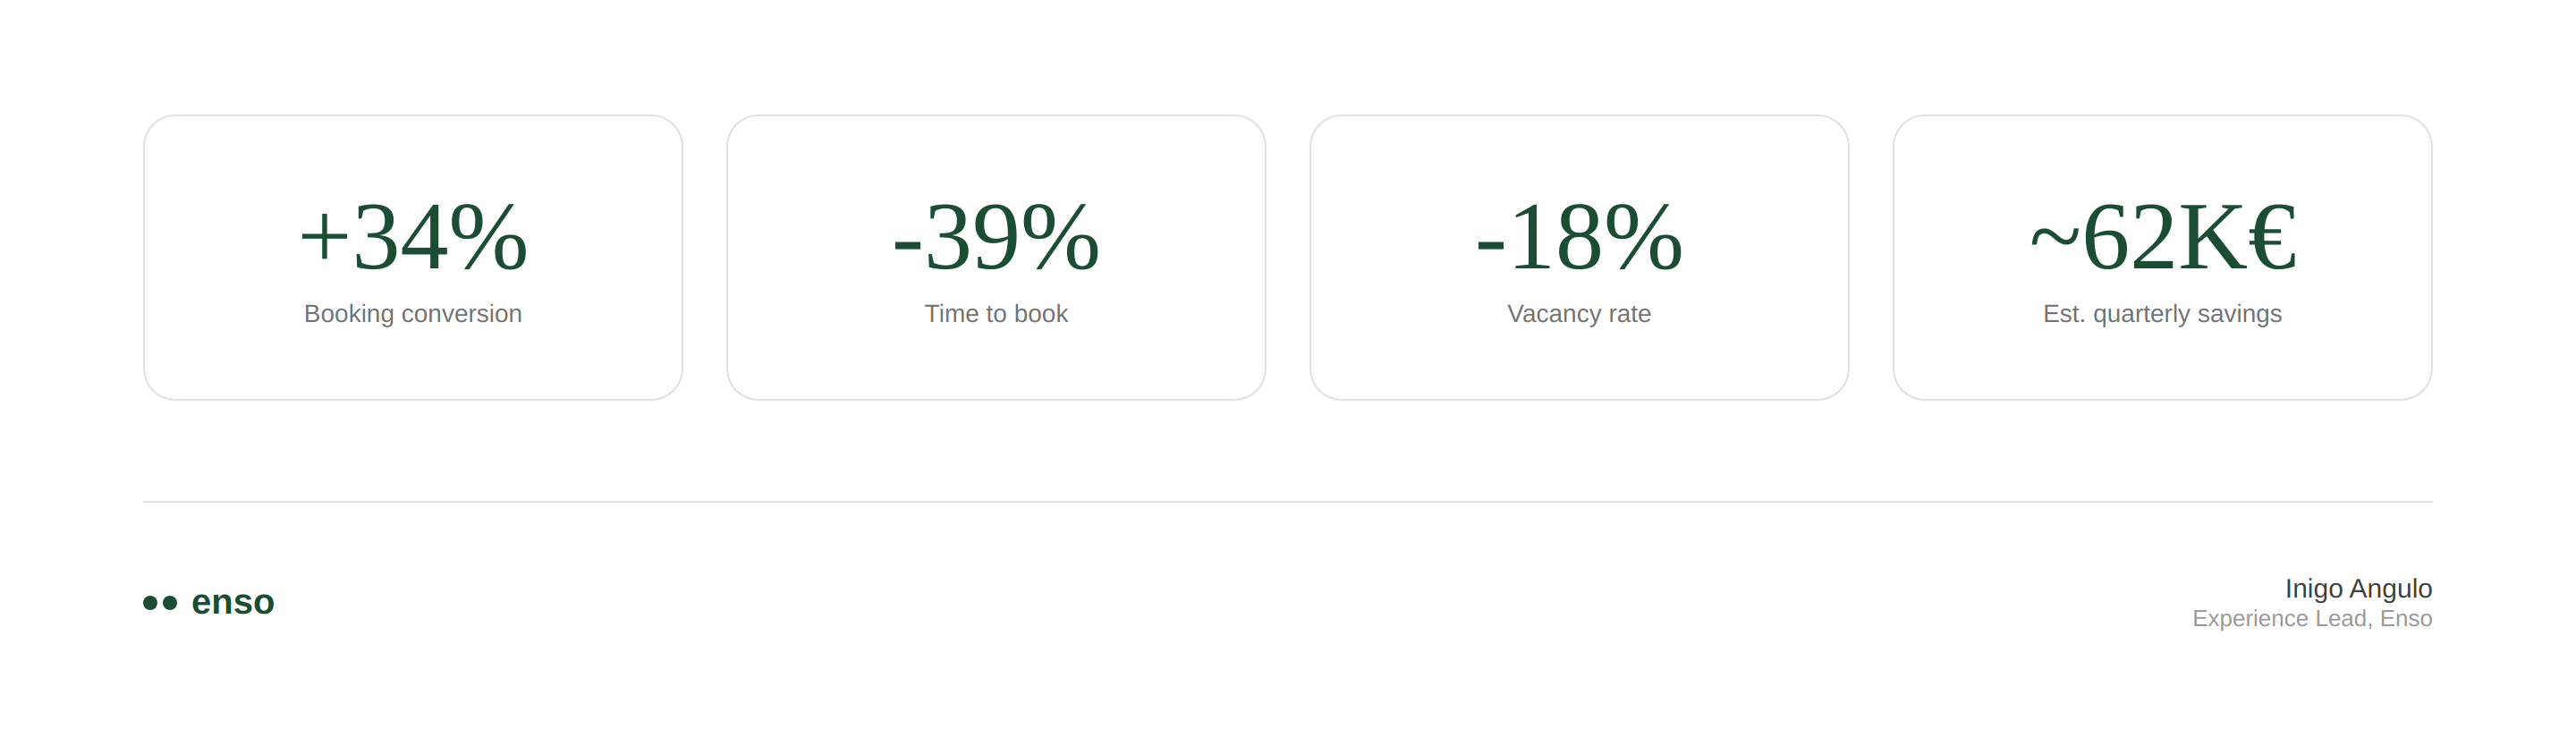
+34%Booking conversion
ValidationPostHog A/B test. 14,208 users, 28 days, 95% significance on Day 16. All guardrails passed.
Impact
Next case study KODO Arbitrage →
×